Introduction
The dimeric terpene-indole alkaloid – vincristine sulfate (VCR) is used as an antitumor agent since the 1960s [1, 2]. Despite the therapeutic value of vincristine and vinblastine, the low selectivity of the drug action in the organism causes some undesirable effects. Excellent prospects in the field of antitumor chemotherapy are currently associated with the targeted delivery of drugs to the body, tissue or cells. Drug delivery systems play a significant role in improving the quality of chemotherapy in oncological disease. The development of new methods of drug delivery has become a topic of keen interest in chemotherapy.
Nowadays systems for the delivery of chemotherapeutic agents are very diverse, and each one has its advantages and disadvantages. Most types of the drug delivery systems (liposomes, dendrimers, nanoparticles, polymer conjugates, and so forth) have а synthetic nature and metabolism in the body can produce toxic products that can be invoked by toxic effects during elimination and other complications [3–8]. Moreover, a technological point of view design and development of synthetic carriers is a highly costed process. Therefore, it is essential to develop more natural type systems which can be employed in different type of applications. In the first case, researchers were selected autolytic cells of the body (ex, blood cells), which are naturally origin as a carrier of various substances in the body. Biodistribution, Pharmacokinetics and biological activity are the key parameters, which are determining the success or failure of therapeutics. Many of the research and developments intended to improve their in vivo performance, aim at biodistribution, modulating therapeutic concentration, and targeting to organs, tissues, cells or subcellular compartments. Erythrocytes-based drug delivery systems are especially efficient in maintaining active drugs in circulation, in prolonged releasing them or in targeting drugs to select organs, tissued or cells. Erythrocytes can also be easily processed to entrap the desired active pharmaceutical ingredients before re-infusion into the same or matched donors.
The first attempt of encapsulation chemicals compounds into the erythrocytes was made out by Gardos [9], who tried to load ATP into the “erythrocyte ghosts” in 1953. The first reports on loading the erythrocyte ghosts by therapeutic agents (β-glucosidase and β-galactosidase) for delivery purposes were published independently by Ihler [10] in 1973. As a drug delivery system (DDS), isolated cellular carriers (red blood cells (RBCs), lymphocytes, platelets, leukocytes, granulocytes, etc.) have some advantages in some aspects compared to the synthetic DDS: high biocompatibility, complete biodegradability, low probability of any undesirable immune reactions against the encapsulated drug, the drugs which are carrying by cells can circulate intravascular over an extended period.
Advantages and disadvantages of the cellular carrier (CC)
Advantages [9, 11–13]:
- A higher degree of biocompatibility - there are no any other toxic metabolites generated after the complete biodegradability of CC [13].
- There is a low probability of undesirable immune reactions against encapsulated drugs.
- Substantial protection of the body from unwanted effects of drugs (antineoplastic agents).
- The possibility of prolonging the action of the drug, as well as RBCs (erythrocytes), can circulate in the bloodstream for a long time.
- CCs can protect against inactivation of the encapsulated drug from endogenous factors.
- The possibility of modification of pharmacokinetics and pharmacodynamics parameters of the medicament.
- The ability to maintain a constant therapeutic dose for an extended period can significantly increase the dosage interval of the drug.
- The possibility of encapsulating a relatively high amount of the drug into small amounts of red blood cells.
- The ability to maintain approximately ideal zero-order encapsulated drug release kinetics.
Disadvantages [9, 14, 15] :
- The main problems arising from the use of biodegradable materials or natural cells as drugs carriers they can be eliminated in natural conditions by reticuloendothelial system (RES), as a result of the integrity damage of the CC membrane. However, this defect can be eliminated with the help of different encapsulated technology.
- Rapid release of encapsulated drugs is possible. However, this kind of defect can be eliminated with the aid of various linkers.
- Specified conditions and facilities are needed for the storage purposes.

Figure 1. RBC morphology.
The shape of erythrocytes in a normal unshared condition is flexible biconcave discs with a cell diameter of ~7.0 to 10.0 μm and ~2.0 μm thickness [14, 16, 17] (Figure 1). The biconcave disk shape of the RBCs endowed the highest surface area to volume ratio (SA/V), which facilitates large reversible elastic transformation into any arbitrary shape and enables large deformations, and it is important in order to the maintaining of erythrocyte gas exchange function. The surface area (SA) of the mature biconcave erythrocyte is about 136 μm2, cell volume ~90 fL, and still can swell to a sphere shape volume of approximately 150 fL. Also, this unique cell form has a high degree of flexibility necessary for the passage of red blood cells through capillaries in diameter 3–4 μm, without undergoing extensive remodeling [18]. The membranes of erythrocytes withstand high shear stress, rapid elongation and folding in microcirculation and deformation as the erythrocyte passes through small fenestration of the spleen [19]. The erythrocyte membrane has a specialized structure consisting of a basic plasma membrane composition, including lipids, proteins (membrane skeletal proteins such as glycophorin A, B, C), and carbohydrates. The proteins of the membrane skeleton are responsible for the deformability, flexibility, and durability of the red blood cell. Erythrocytes cell membrane structure is playing a vital role in order to maintain the integrity of erythrocytes when exposed to high rates of shear in the circulation, as well as the reticuloendothelial system (RES) [20]. The RBC membrane is strictly connected with skeletal cell membranes proteins, which are organized in a uniform shell and it confers to cell undergo some reversible transformations. An essential determinant of RBC survival is its deformability, an inherent viscosity (mainly contributed by RBC haemoglobin), the surface area /volume ratio of the cell and the intrinsic deformability of the membrane are the key factors affecting the erythrocytes deformability. When decreasing the osmolality in the surrounding environments, the red blood cells become cup-shaped and, finally, spherical [20, 21]. This type of swelling process lay at the basis of the most implemented methods exploit to load medicaments or other active pharmaceutical compounds into the erythrocytes. Finally, red blood cells have been considered by several researchers use as circulating bioreactors for the degradation of toxic metabolites or the inactivation of xenobiotics, as drug delivery systems, as carriers of antigens for vaccination, and in several other biomedical applications. Generally, erythrocytes can be used as carriers in two main directions [22]:
- The orientation of a particular tissue/organ – in this case, the membrane and cytoskeleton elements of the erythrocyte use as a carrier. The erythrocyte devoid of cytoplasmic contents is obtained by hypotonic lysis, and after the encapsulate, which are preserving the original morphology. Such post-hemolytic plasma membranes of erythrocytes sometimes called “erythrocytes ghosts” [23, 24].
- The continuous or prolonged drugs release, erythrocytes can be used as a continuous or sustained release system that provides a prolonged effect. There are various methods for encapsulating drug substances into the erythrocytes. They remain in the circulating bloodstream for extended periods of time (up to 120 days) and release the encapsulated medicinal substances at a slow and constant rate.
There are a few methods used for the entrapment of drugs into erythrocytes, osmotic lysis, electric field lysis (electroporation) and dialysis are the standard methods in use [25] (Figure 2). Figure 3 demonstrates the steps involved in the osmotic lysis and resealing process of erythrocytes. In the presence of hypotonic solution (low osmotic pressure), water enters into the erythrocytes and swells the cells. The erythrocytes can swell in size up to 1.6 times from the original volume before sufficient stress develops to rupture the membrane and cause the appearance of pores in the cell membrane. The occurred membrane pores are 200-500˚A in size and can be allowed equilibration of the intracellular and extracellular medium. The period that these pores remain open is uncertain, however, at 0˚C the pores are open long enough to provide partial equilibration of the intra and extracellular medium. Extracellular substances may enter the erythrocytes at the same time that the intracellular substances can exit during hypotonic hemolysis. The substances that may enter the swelled cells are low-molecular-weight compounds such as drugs, macromolecules such as proteins and enzymes, and even relatively large structures such as viruses. Advancing the solution hypotonicity to isotonicity and incubating the erythrocytes at 37˚C causes the pores to close and restore the osmotic properties of the erythrocytes membrane. After resealing, exogenously administered substances are remain in the erythrocytes, which can be performed as containers or carriers for the entrapped compounds in vivo.

Figure 2. Main procedures for the entrapment of drugs in erythrocytes.

Figure 3. Schematic illustration of hypotonic hemolysis drugs loading method.
Strategically, these facts gave the potential stimulation to investigate the possibility to use cellular carriers (erythrocytes, leukocytes, monocytes, and so forth) as a delivery system for vincristine and vinblastine to improve the efficacy of these drugs. In the process of encapsulation, the corresponding pharmacological active substances can damage the integrity of red blood cells. Severely damaged red blood cells can be quickly eliminated from the bloodstream with macrophages in the RES, however, there are some successful experiments carried out by different researchers, which were used the erythrocyte as a drug delivery system for the various classes of drugs (antibiotics, antineoplastic, enzymes, and so forth) [22]. Nevertheless, the effects on the morphological and functional properties of erythrocytes after the extracorporeal saturation with therapeutics still remains unclear.
The efficiency of RBCs as a carrier is directly dependent on the extent of damage to morphological and physicochemical properties of encapsulated red blood cells. The in vitro studies of TIAs loaded erythrocytes are allowing to predict the behavior of TIAs loaded erythrocytes in the body. The primary purpose of this work was to evaluate the parameters (morphological, physicochemical) of TIAs encapsulated human erythrocytes, and study the functional state of erythrocytes subjected to extracorporeal saturation with TIAs.
Material and Methods
Reagents and chemicals
Isolated human erythrocytes were used to encapsulate TIAs drugs. In the study the following reagents were used: Vinblastine-LANS® (LENS-PHARM, Russia) and Vincristine-Teva (Teva Pharmaceutical Industries Ltd, Israel), VERO Vincristine (LENS-Pharm, Russia), Vincristine-Richter (Gedeon Richter Ltd, Hungary), Adenosintriphosphate sodium (Biomed, Russia), which are meet all the requirements of the current regulatory documentation in Russia, were purchased on the domestic market in Voronezh.
In the modified encapsulation processes, Polyethyleneglycols (PEG) 4000 and PEG-400 (Sigma-Aldrich Germany) and 99% solution of Dimethyl Sulfoxide (DMSO) (TATHIMPHARM Preparations, Russia) were used.
All chemicals, reagents and solutions corresponded to the purity requirement "Analytical Reagent." Donors blood was collected from the analytical laboratory of the clinical hospital and after the sample was collected immediately stored in a refrigerator at +4˚C until the time of use.
Instruments and appliances
The quantitative analysis of TIAs was carried out employing a previous validated analytical method. In these experiments were used Thermostat TS-1/20 SPU (Russia), Centrifuge OPN-8 (Russia), Hitachi Ratio Beam Spectrophotometer U-1900 (Japan) and SF 2000-01 (Russia), Levenhuk 870T Trinocular microscope (USA), pH meter model 150М(Russia), Refractometer IRF 454 B2М (Russia).
Data processing was conducted by using software packages, Microsoft Excel 2016 (Microsoft, USA) and Origin Pro 2015 (OriginLab Corp., USA).
Statistical analysis
The quantitative determination method is developed based on the model mixtures, in which are the content of the substance to be determined was known. Received results were processed in accordance with the requirements and use the package of application software Origin Pro 2015 (OriginLab Corp., USA), Statistica 12.0 (Statsoft, USA) and Microsoft Excel 2016 (Microsoft, USA). The significance of the differences in the average values was estimated by the criteria Student and Mann-Whitney. The relative error of the average measurement result was estimated using the Student's distribution criterion:

where t(P, f) is the Student's test (definitions by tables); n – number of observations;  – the arithmetic mean; f (degree of freedom) = n-1; p – reliability.
Calculation and statistical evaluation of the linear dependence parameters were carried out according to the requirements of the general pharmacopoeial article GPA.1.1.0013.15 in Russia.
Allogeneic erythrocytes isolation
In the experiments were used blood samples (anticoagulated with heparin 5000 IU/ml), withdrawn from healthy volunteers. Erythrocytes were isolated from human peripheral blood samples using the method of Boyum (1968), which was based on sedimentation in a single-stage ficoll-urographin density gradient. Ficoll is in this mixture acts as an erythrocytes aggregating agent, and isopak (or urographine) is needed to create solution isotonicity and adjust the solution density to 1.077 g/cm3. About 2.0 ml volume of heparinized blood sample was diluted with 2 times volumes of 0.01 M Na-phosphate buffer; after that, the cell suspension was gently poured into a centrifuge tube with 3.0 ml of ficoll on the bottom. The cell suspension was centrifuged at 400 g (2,000 rpm) at 20°C for 40 minutes. After the centrifugation plasma and the leukocytes layer were carefully separated, the isolated erythrocytes were washed several times with 0.01 M Na-phosphate buffer and centrifuged at 3,000 rpm for 10 minutes. The supernatant was discarded, and the isolated erythrocytes were resuspended in isotonic NaCl solution containing 3% (w/v)) dextran and stored in a refrigerator at +4°C until the time of use. Before the applications, the red blood cells were centrifuged at 3,000 rpm for 5 minutes; the supernatant was discarded. The packed erythrocytes were resuspended in a 0.9% solution of sodium chloride and centrifuged at 3,000 rpm for 10 minutes (this procedure was repeated at least three times). The presence of other uniform cell elements in the erythrocyte suspension was controlled using light-emission microscope.
Encapsulation of TIAs drugs in erythrocytes
A modified hypo-osmotic lysis method was employed to TIAs encapsulation. The method is represented by the following procedures:
- Isolation erythrocytes, leukocytes, and platelets from blood plasma removing leucocytes and palettes from blood cells fraction, washings isolated erythrocyte suspension several times.
- Carry out the hypotonic lysis of isolated erythrocytes.
- Perform complete lysis and encapsulates TIAs drugs into erythrocytes, then re-sealing the red blood cells.
- Additional rinsing of lysed re-sealing red blood cells to remove non-encapsulated drugs.
- Resuspension encapsulated erythrocytes in plasma or Phosphate-buffered saline solution (PBS).

Figure 4. Schematic representation of TIAs encapsulation method into the isolated erythrocytes.
Stages (Figure 4)
1) Erythrocytes swelling were performed with 1.0ml of isolated erythrocytes (packed erythrocytes). About 4.0 ml volume of 0.65% NaCl solution (hypo-osmotic solution) cooled down to 00c was added into 1.0 ml packed erythrocytes (no visible hemolysis was observed at this concentration), and the resulted cell suspension was incubated for 5 minutes at 0°C. After the incubation period cell suspension was centrifuged at 8,000 rpm for 5 minutes to recover the swollen cells.
2) After centrifugation, the supernatant was discarded. 8.0 ml (total volume) aqueous solution of TIAs drugs (vincristine sulfate and vinblastine sulfate – 125 μg/ml, 250 μg/ml, 275 μg/ml) cooled down to 00C was added under constant agitation to the recovered swollen cells (drug solution was added until the cells reach lysis point). 500 µl volume of drug solution was found to be sufficient to bring the cells to the lysis point. Further addition of drug solution resulted in complete lysis of cells, which was observed during the process by optical microscope).
3) The resulted cell suspensions were incubated for 20 min at 4°C. After the incubation period, 1/9 volume part (1.0 ml) of 9.0% sodium chloride solution was added to restore the integrity of the erythrocyte membrane and incubated at 37°C for another 30 min. In some cases, additional volumes of hypertonic sodium chloride solution have to be added to restore the RBC integrity.
4) After the inclusion of the drugs into erythrocytes were washed twice with isotonic sodium chloride solution, to remove the released hemoglobin and the non-entrapped drugs, followed by precipitated at 8000 rpm for 10 minutes at room temperature.
5) The precipitated TIAs encapsulated erythrocytes were resuspended in 1.0 ml volume of Na-phosphate buffer solution (pH 7.4) with 3.0% dextran and store in the refrigerator at +4°C.
Assessment of TIAs encapsulation efficiency
The drug encapsulation efficiency is a significant indicator in evaluating and the ensure quality of the drug-loaded erythrocytes forms. The encapsulation efficiency (E%) of theTIAs drugs can be defined as
E% = (m*100%)/M,
where m – the total amount of encapsulated drugs (mg, μg), M – the total amount of drugs added into the incubation medium (mg, μg).
A previously validated analytical method was used for the quantitative analysis of TIAs (VCR, VLB) [9]. The ultraviolet (UV) spectral characteristics of TIAs (VCR, VLB) had been implemented to the identification of TIAs in the analytical probes. The analytical method is based on the spectrophotometric characteristics of C. roseus alkaloids absorption spectrum in the UV regions, VCR and VLB have a maximum absorption peak λ(max) at 295 nm for vincristine and λ(max) at 268 nm for vinblastine in the purified water [7]. The metrological characteristics of the calibration curves of the analytical method were y = 0.0195x + 0.0112 for VCR and y = 0.0192x + 0.0115 for VLB respectively, where x – the optical density of the analytical probe at the appropriate wavelength, 295 nm for VCR and 268 nm for VLB.
Sephadex-G25 filled columns were applied for the drugs isolation from the analytical probes. The quantitative content of TIAs in loaded erythrocyte was determined after complete hemolysis of the drug-loaded erythrocytes in the hemolysate and also in the discarded supernatants (I) after the TIAs encapsulation process.
As a result, the contaminant substances contained in the biomaterials (plasma proteins, etc.), directly determination TIAs in the biological material (blood, plasma, etc.) is problematic, therefore the isolation TIAs drugs from the concomitant substances were used gel filtration method.
About 1.0 ml of TIAs loaded erythrocytes suspension after the two times washed with isotonic NaCl solution was added 7X times volume (7.0 ml) of distilled water. Moreover, erythrocytes hemolyzed under continuous freezing and thawing process by two times, after that resulted suspension was heated in a water-bath at 80˚C to achieved complete rupture of the erythrocytes (approximately 10 minutes). After that, the resulted suspension was cooled until to the room temperature and centrifuged at 2000 rpm for 30 min, the supernatant was collected and filtered using a paper filter. About 2.0 ml of 30% trichloroacetic acid was added into the filtrate, mixed and centrifuged again for 5 minutes at 8,000 rpm. The supernatant was collected and neutralized. The TIAs (VCR, VLB) contain in the decanted supernatant was isolated using the gel filtration method. The collected drugs contain fractions were analyzed by a Hitachi Ratio Beam Spectrophotometer U-1900 (Japan).
Study of alternatives for the enhancement of TIAs encapsulation efficiency
Some physical factors of the external environment like the concentration gradient, electrochemical gradient, electrostatic gradient (for filtration processes), osmotic gradient, solubility gradient at the boundary of two immiscible phases, for example, lipid and aqueous substances can make an important impact on the passive penetration of substances through the erythrocyte membrane. Efficiency of erythrocyte loading can be influenced by internal osmotic pressure and external environment of erythrocytes. Create a large, transient osmotic gradient across the erythrocyte membrane can affect the efficiency of the encapsulation of the molecule within the erythrocytes. Polyethyleneglycol (PEG) and Dimethyl Sulfoxide (DMSO) were utilized to create a high osmotic gradient through the erythrocyte membrane.
Encapsulation TIAs into erythrocytes in a modified incubation medium containing PEG
Pre-swelling hypo-osmotic lysis method was employed for the TIAs encapsulation and carried out in an incubation medium containing PEG-4000 and PEG-400. PEG has the ability to increase osmotic pressure in the incubation medium and ability to stabilized erythrocytes membrane. The TIAs encapsulation was performed in the incubation medium containing different concentrations of PEG-400 and PEG-4000, and the other conditions and encapsulation procedure have been remained unchanged. The drug-loading process was carried out by adding solutions containing TIAs: PEG (w/w): 1:5, 1:10, 1:20; 1:50; 1:100 (TIAs drugs – VCR and VLB were dissolved in PEG aqueous solutions according to the above indicate concentration ratios).
The osmotic pressure in the incubation medium can be calculated by the following formula:
P = i CRT
where i – the isotonic coefficient of the solution; C – the molar concentration of the solution (mol/m³); R – the universal gas constant; T – the thermodynamic temperature of the solution.
The calculated osmotic pressure values in the different incubation mediums are presented in Table 3 and Figure 5.
The encapsulation efficiency assessment procedure has been remained unchanged as previously described.

Figure 5. Relationship between TIA: PEG concentration and osmotic pressure in the incubation mediums.
Encapsulation TIAs into erythrocytes in modified incubation medium containing DMSO
In this case, TIAs encapsulation was carried out in a modified incubation medium containing DMSO, with the concentration 2 mg/ml; the other conditions have been remained unchanged. VCR and VLB were dissolved in 2 mg/ml DMSO aqueous solutions. The encapsulation efficiency of TIAs in erythrocytes was evaluated using the previously described methods.
Encapsulation TIAs into erythrocytes in modified incubation medium containing adenosine-5’-triphosphate
Adenosine-5’-triphosphate (ATP) is the primary energy source, which is using in the erythrocytes, participates in maintaining their shape and volume. Intracellular ATP concentration is ~10-3 M, and in the blood plasma it does not exceed 10-6 M. The energy releasing during the hydrolysis of the high-energy phosphate bond on ATP molecule, provides an active transport of cations through the membrane, maintaining the optimal ratio concentrations of K+ and Na+ (maintenance of normal operation of Na+/K+ channels), preservation of the shape and integrity of the erythrocyte membrane and formation membrane potential of erythrocytes. The presence of ATP is essential in maintaining the biconcave shape of erythrocytes and also significantly affects the erythrocytes deformability. In the absence of ATP, erythrocytes loss its biconcave shapes and become flattened echinocytes. In this experiment, the TIAs encapsulation into erythrocytes was performed in the presence of a high concentration of ATP (2.2 mg/ml) in an incubating medium. Moreover, the other conditions and encapsulation procedure have been remained unchanged.
ATP has maximum absorption in the UV region λ(max) at 260 nm, and it makes more difficult to detect VLB in the analytical probes, which has a maximum absorption at a wavelength 268 nm in the purified water. After the gel filtration process, ATP content in the obtained filtrate rather higher than TIAs, and it interferes the detection of TIAs in the probes directly. Before the employ spectrophotometric method detection of TIAs, it is necessary to isolate TIAs from ATP contained in the filtrate. TIAs drugs: VCR and VLB are fairly dissolved in chloroform (1 part to 30 parts of chloroform), ATP practically did not dissolve. The extraction method was employed for the TIAs isolation based on their solubility characteristics in chloroform. After the extraction, TIAs was determined by UV spectroscopy.
In vitro study of morphological and physicochemical properties of TIAs loaded erythrocytes
To evaluate the surface architectonics of erythrocytes were used optical microscopy. TIAs loaded erythrocytes were observed under an oil immersion lens with an optical microscope Levenhuk 870T Trinocular (USA). Using the Toupviwe PC program, the diameters of TIAs loaded and control erythrocytes (n-100) were calculated.
To determine the morphological and physicochemical properties of TIAs encapsulated erythrocytes were applied the turbidity spectrum method and the assessment of osmotic resistance of erythrocytes (ORE) in a low osmolarity medium. Variations in the morphological and physicochemical parameters of TIAs encapsulated erythrocyte were examined, and as a control probe was used freshly isolated erythrocytes incubated in an isotonic NaCl solution at 37˚C.
The turbidity spectrum method is based on the fact, that the light passing through a dispersed system is scattered by suspended particles and the optical density of the suspension depends on the size, concentration of particles dispersed in the medium, the wavelength of light and the relative refractive index of the particles, which depends on the physiological state and chemical composition of the particles. The advantage of the turbidity spectrum method in determining the characteristics of erythrocytes of the disperse phase, the absence of complex instrumentation and the possibility of calculating the erythrocytes size, their numerical concentration and, respectively the total surface area. The ORM technique is accurate, objective, easily feasible and, most importantly, allows us to characterize not only the minimum and maximum resistance of erythrocytes but also the dynamics of hemolysis.
In this experiment was established, 0.01 M Na-phosphate buffer with pH 7.4 is an adequate solution for the incubation of RBCs, and TIAs encapsulated erythrocytes. Erythrocytes can retain their functional properties for several days in this solution. The turbidity spectrum usually represented as a graph, which are plotted values of the system turbidity (τ) dependence on the wavelength (λ) of incident light. The graph dependence can be defined as
τ = (2.3A)/l,
where, A – the optical density, l – the length of the cuvette cell (cm).
The size (radius) of erythrocytes is calculated after the experimental determination of the relative refractive index of erythrocytes – μery. The dependence can be defined as:
r ̅ =(μmα)/(4πμ0(m-1)),
where, (r ̅) – the radius of erythrocytes, m – the relative refractive index of the medium, (m = μery/μ0), μery – the relative refractive index of erythrocytes, μ0 – the relative refractive index of the incubating medium, α – function of relative dimension (α = 2πr/λ).
The relative refractive index of erythrocytes was determined by the refractometric method. A series of incubation medium was prepared with the relative refractive index (μ0) was in the range 1.3–1.4 with 0.01 gradient. The relative refraction index of the medium was adjusted by dissolving the different amount of PEG-4000 in the incubating medium. The relative refractive index (μ0) is measured in a refractometer model IRF-454 B2М (Russia). 0.2 ml volume of control and TIAs encapsulated erythrocytes are diluted to 2.0 ml by adding Na-phosphate buffer, and 0.1 ml volume of dilute erythrocyte suspension is added to each incubation tube (total volume of incubation medium – 5.0 ml), thoroughly mixing until the red blood cells are completely dispersed.
After that, the optical density of each suspension was measured in the Hitachi spectrophotometer at the wavelength range (λ) – 600-900 nm with 10 nm gradient, the wave exponent (n) of each suspension was calculated from the resulted absorption spectrum.
The value of α was determined using the table, which is presented as the calculated value of n = n(α) published in the monograph by Klenin et al. [26]. Further, μery is determined by extrapolation of the approximated trend line to the abscissa using the plot of  dependence on the relative refractive index of medium (μm).
The parameters of erythrocytes were calculated as follows:
1) The numerous concentrations of erythrocytes in a single volume (1cm3) are determined by:
 ,
,
where, K – the scattering coefficient, is given in the monograph by Klenina et al. [26].
2) Erythrocyte density (g/cm3): ρ = 1+1.5(m-1).
3) Concentration of dry substances in erythrocyte (%):
C% = 605.0 (m-1).
4) Dry matter content in the erythrocyte (pg):
CDM = 3.15 (m-1)r ̅ 3.
5) The water content in the erythrocyte (%):
Cwater (%) = 100-0.75 С%.
6) Erythrocytes membrane permeability index (EMPI):
EMPI = CDM/Cwater
7) Mean corpuscular volume (MCV): MCV = V/N, where, the V – diluted erythrocytes suspension added into measuring tubes (0.01 cm3), N – calculated total erythrocytes in 1 cm3.
8) Calculation of surface area (SA) of an erythrocyte:
For the practical purpose of this experiment, it would be useful to find approximated models which give formulas based on diameter and thickness. According to that, it has been proposed to consider that the diameter squared of an erythrocyte determines the size of its surface area, while the thickness does not have a major influence. The spheroid with concave caps model of the erythrocytes was used to the SA calculation.

Volume of erythrocytes was calculated [27] by
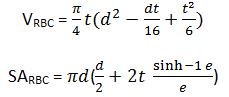
where,  , t – thickness, d – diameter.
The thickness (t) of erythrocytes calculate by 
In vitro study of osmotic resistance of TIAs loaded erythrocytes
To determine the osmotic resistance of TIAs loaded erythrocytes (ORE) was used freshly prepared TIAs loaded erythrocytes. The minimum resistance of erythrocytes is determined using the maximum concentration of a hypotonic (less than 0.85%) sodium chloride solution which begins the slight hemolysis in the erythrocytes within 1h incubation period at 37˚C. The maximum resistance of erythrocytes is determined by the maximum concentration of a hypotonic solution of sodium chloride that causes complete hemolysis of erythrocytes within 1h incubation period at 37˚C.
0.5 ml of the TIAs loaded erythrocytes was diluted to 2.0 ml by adding the isotonic Na-phosphate buffer (pH 7.4). Stepwise decreasing sodium chloride solutions were prepared with the following concentrations: 0.90%, 0.80%, 0.70%, 0.65%, 0.60%, 0.50%, 0.40%, 0.30%, 0.20%, and 0.10%. 0.02 ml of the diluted erythrocytes suspension was added into each tube contain 5.0 ml volume of NaCl solution and incubated for 60 minutes at 37°C.
After the incubation, the erythrocytes suspension was centrifuged at 2,000 rpm for 5 minutes, and the supernatant was collected accurately. The optical density of the decanted supernatant (allocated hemoglobin) was determined at a wavelength of 500-560 nm (with green light filter) in a cuvette with an optical path length of 1 cm against the control sample. Freshly prepared 1% sodium chloride solution was used as control solution for spectrophotometry. Theoretically, hemolysis of erythrocytes occurred in the 0.1% sodium chloride solution considered as complete (100%) hemolysis of erythrocytes. The hemolysis index in each sample was calculated by the formula:
Hemolysis index (%) =Ex/Ei *100%,
where Ei – the optical density of 0.1% solution of sodium chloride; Ex — the optical density of the analyze sample.
In vitro drug release analysis of TIAs loaded erythrocytes
To define the stability of possible desorption and excretion of encapsulated TIAs to the bloodstream, the following experiments were carried out. About 1.0 ml volume of encapsulated erythrocytes washed twice with an isotonic sodium chloride solution and after that incubated in 9.0 ml isotonic buffer at 37°C: 5 minutes, 10 minutes, 20 minutes, 40 minutes, 60 minutes, 120 minutes, 240 minutes, 360 minutes. After the period of each incubation period, erythrocytes were centrifuged at 2,000 rpm for 5 minutes, and a certain amount of supernatant (8.0 ml) was collected for analysis and replaced by the same amount of fresh isotonic buffer. TIAs drugs contained in the discarded supernatant were isolated by using the gel filtration and TIAs (VCR, VLB) in the filtrate was analyzed using a Hitachi Ratio Beam Spectrophotometer U-1900 (Japan) at an appropriate wavelength under the room temperature.
In vitro hemoglobin leakage of TIAs loaded erythrocytes
Assessment of the in vitro outflow of hemoglobin from TIAs loaded erythrocytes were carried out in the same manner as in the in vitro drug release. The supernatants were withdrawn at a regular interval, and absorbance was recorded at 540 nm. The isolated un-encapsulated erythrocytes incubated in Na-phosphate buffer (pH 7.4) at 37°C were used as a control. Allocations hemoglobin from the encapsulated erythrocytes was calculated as the ratio of content hemoglobin in the control sample after the complete hemolysis (9.0 ml volume of purified water was added to 1.0 ml freshly isolated un-encapsulated erythrocytes and performed complete hemolysis). Hemolysate was centrifuged at 5,000 rpm for 20 minutes and containing hemoglobin in the discarded supernatant was considered as the situation of 100% release of hemoglobin).
The assessment of the TIAs encapsulated erythrocytes stability during the storage
In this experiment, TIAs encapsulated erythrocytes were incubated in Na-Phosphate buffer at various temperatures. Stability of TIAs loaded erythrocytes was determined by the hemoglobin release index from erythrocytes during the storage period. Degrees of hemolysis of erythrocytes indicate that the ability to preserve the integrity of erythrocytes during storage. Erythrocytes with higher hemolysis index have indicate the scale of the destruction of the erythrocytes integrity, and damage erythrocytes will have lost the ability to maintain the encapsulated dose of TIAs drugs in the erythrocytes.
Assessment of the hemolysis index of TIAs encapsulated erythrocytes:
1) A series of 10 ml of Na-Phosphate buffer solutions, which is contains 24 samples were added 0.5 ml volume of TIAs encapsulated erythrocytes into each samples and stored at +4°C, +10°C, +15°C, and at room temperature for the different period (1 day, 3 days, 6 days, 1week, 2 weeks, 3 weeks, and 4 weeks).
2) A certain amount of supernatant (8.0 ml) was taken from each sample, therefore 0.5 ml of the decanted supernatant was diluted to 10 ml with Na-Phosphate buffer, and the optical density of the resulting solutions was measured at wavelength 540 nm in Hitachi Ratio Beam Spectrophotometer U-1900.
3) The control sample was prepared, as following: freshly isolated 0.5 ml of erythrocytes after 2 times washed with an isotonic solution was incubated in Na-Phosphate buffer at the appropriate temperature for 6 hours (every time used freshly prepared control samples obtained under the identical conditions).
The hemolysis index was calculated by the formula:
K(HI) =D(TIA-Ery))/D0,
where K(HI) – hemolysis index, D(TIA-Ery) – the optical density of the analyzed probe, D0 – the optical density of the control probe.
The study of the TIAs loaded erythrocytes to maintaining encapsulate drugs during the storage studied as follows
About 1.0 ml of TIAs encapsulated erythrocytes were incubated in 10 ml of Na-Phosphate buffer and stored at +4°C for the different period (1 day, 3 days, 6 days, 1 week, 2 weeks, 3 weeks, and 4 weeks). After every storage period remains drugs in the encapsulated erythrocytes were determined and calculated applying previously described method under the topic “assessment of TIAs encapsulation efficiency”.
Results
The VCR and VLB were demonstrating rather closer encapsulation efficiency into the erythrocytes. Observed results (Tables 1 and 2) are shown the impact, which made by storage period of isolated erythrocytes to TIAs encapsulation efficiency. It can be seen that the isolated erythrocytes after the more than 24 hours storage period, showing significantly reduced TIAs encapsulation efficiency (VCR – 32.449±2.174% and VLB – 31.215±3.503%), compared to freshly isolated red blood cells (VCR – 42.963±2.648% and VLB – 44.266±2.432%), P<0.05 (data presented as mean with standard deviation – M±SD). In the comparative data, which are demonstrated the encapsulation efficiency of TIAs on average can be seen during the encapsulation process run to waste a fairly amount of TIAs drugs. Such a case in a pharmacological, technological and economically point of view are not beneficial. Therefore, it was necessary to study the possibilities to the improvement of the encapsulation efficiency of TIAs drugs into erythrocytes carriers.
Table 1. TIAs encapsulation efficiency related to the storage period of isolated erythrocytes
|
Probe № |
TIA (drug name) |
Characteristic of isolated erythrocytes (storage under +4°C) |
Added amount for incubation, µg |
Amount of encapsulated TIA, µg |
E% |
Metrological characteristics |
|
I |
VCR |
After 1 week store at +4°C |
1100 |
385.271 |
35.025 |
SD = 2.1739
ξ = 21.304% |
|
II |
VCR |
After 2 week store at +4°C |
1100 |
365.741 |
33.249 |
|
|
III |
VCR |
After 3 week store at +4°C |
2100 |
662.342 |
31.540 |
|
|
IV |
VCR |
After 4 week store at +4°C |
2200 |
659.639 |
29.984 |
|
|
I |
VCR |
Freshly isolated |
1100 |
467.932 |
42.539 |
SD = 2.482
ξ = 18.368% |
|
II |
VCR |
Freshly isolated |
1100 |
435.847 |
39.622 |
|
|
III |
VCR |
Freshly isolated |
2100 |
944.816 |
44.991 |
|
|
IV |
VCR |
Freshly isolated |
2200 |
983.417 |
44.701 |
|
|
I |
VLB |
After 1 week store at +4°C |
1500 |
511.968 |
34.131 |
SD = 3.5026
ξ = 35.682% |
|
II |
VLB |
After 2 week store at +4°C |
1500 |
500.449 |
33.363 |
|
|
III |
VLB |
After 3 week store at +4°C |
2000 |
620.323 |
31.016 |
|
|
IV |
VLB |
After 4 week store at +4°C |
1500 |
395.280 |
26.352 |
|
|
I |
VLB |
Freshly isolated |
1000 |
426.568 |
43.568 |
SD = 2.432
ξ= 17.467% |
|
II |
VLB |
Freshly isolated |
1500 |
618.527 |
41.235 |
|
|
III |
VLB |
Freshly isolated |
2000 |
937.519 |
46.876 |
|
|
IV |
VLB |
Freshly isolated |
2000 |
907.690 |
45.384 |
E%, encapsulation efficiency.
Table 2. Comparison of the encapsulation efficiency of TIAs drugs into erythrocytes with different storage period
|
Characteristic of isolated erythrocytes |
TIA (drug name) |
E%, M±SD |
Practical content in supernatant I (non-encapsulated drug), M±SD |
Recovered total drug quantity (mean value), % |
The unrecovered amount in the detection, % |
|
Erythrocytes after 1-4 week storage period |
VCR |
32.449 ± 2.174 |
66.753 ± 2.096 |
99.202 |
0.798 |
|
Freshly isolated erythrocytes |
VCR |
42.963 ± 2.648 |
5.938 ± 4.211 |
98.901 |
1.099 |
|
Erythrocytes after 1-4 week storage period |
VLB |
31.215± 3.503 |
67.422 ± 3.382 |
98.637 |
1.363 |
|
Freshly isolated erythrocytes |
VLB |
44.266 ± 2.432 |
54.576 ± 2.677 |
98.842 |
1.158 |
E%, encapsulation efficiency; M±SD, mean with standard deviation.
Table 3. The osmotic pressure in the different incubation mediums contains different amount of PEG
|
Added amount, mg |
Created osmotic pressure in the incubation medium (9.0 ml), KPa |
Osmolarity, mOsmol\l |
The cumulative osmotic pressure in the incubation medium, mOsmol\l |
||||
|
VCR 1.0 mg |
VCR 2.0 mg |
VLB 1.0 mg |
VLB 2.0 mg |
||||
|
PEG-4000 |
10.0 |
0.720 |
0.278 |
0.451 |
0.807 |
0.383 |
0.815 |
|
PEG-4000 |
20.0 |
1.439 |
0.556 |
0.590 |
1.085 |
0.522 |
1.093 |
|
PEG-4000 |
40.0 |
2.879 |
1.111 |
0.868 |
1.641 |
0.800 |
1.649 |
|
PEG-4000 |
100.0 |
7.197 |
2.778 |
1.701 |
3.307 |
1.633 |
3.316 |
|
PEG-4000 |
200.0 |
14.394 |
5.556 |
3.090 |
6.085 |
3.022 |
6.093 |
|
PEG-400 |
40.0 |
28.789 |
11.111 |
5.868 |
11.641 |
5.800 |
11.649 |
|
VCR |
1.0 |
0.312 |
0.241 |
0.241 |
0.241 |
0.241 |
0.241 |
|
VCR |
2.2 |
0.686 |
0.530 |
0.530 |
0.530 |
0.530 |
0.530 |
|
VLB |
1.0 |
0.317 |
0.245 |
0.245 |
0.245 |
0.245 |
0.245 |
|
VLB |
2.0 |
0.697 |
0.538 |
0.538 |
0.538 |
0.538 |
0.538 |
Data presented in Table 3 and Figure 5 can be seen the osmotic pressure was produced by different concentration of PEG-4000 and PEG-400 in the incubation medium. In the conducted experiments were observed the TIAs encapsulation efficiency into erythrocytes was considerably increased in the modified incubation medium with PEG. It was found (Table 4) that the encapsulation efficiency VCR in mean value: 53.302±15.314% and VLB – 46.106±8.707% (P<0.05). When it comes down to the results evidence, It was noticed, that the efficacy of TIA encapsulation is significantly reduced at high PEG concentrations (TIA: PEG – 1:50, 1:100) in the incubation medium (Figure 6). Moreover, the maximum encapsulation efficiency was achieved at TIAs: PEG ratio 1:20 for VCR – 65.699% and VLB – 55.857% (P<0.05). Moreover also, in the modified incubation medium with DMSO (2.0 mg/ml) was shown a high TIAs drugs (VCR, VLB) loading efficiency (Table 5). According to the data, in the modified medium with DMSO can notice 15-20% increments of encapsulation efficiency compared to unmodified incubation medium (in the absence of an aprotic solvent). In the experiment, it was established that the encapsulation efficiency of the VCR in the modified incubation medium can achieve (with an aprotic solvent) – 61.070±2.582% and VLB – 62.425±2.529% (P<0.05). Also (Table 6, Figure 6) showing that the efficacy of TIAs encapsulation in the modified medium with ATP (2 mg/ml) was increased 5-7% compared to the encapsulation efficiency in the unmodified medium: VCR – 49.608±4.247% and VLB – 49.228±5.859% (P<0.05), respectively.
Table 4. The encapsulation efficiency of TIAs into erythrocytes in an incubation medium contain PEG
|
Probe№ |
Drug name |
Type of PEG |
Added TIAs, µg |
TIA:PEG ratio |
Encapsulated TIAs, µg |
E% |
Metrological characteristics |
|
I |
VCR |
PEG-4000 |
2200 |
1:5 |
1190.686 |
54.122 |
SD = 12.318
ξ= 64.243% |
|
II |
VCR |
PEG-4000 |
2200 |
1:10 |
1428.849 |
64.948 |
|
|
III |
VCR |
PEG-4000 |
2200 |
1:20 |
1445.387 |
65.699 |
|
|
IV |
VCR |
PEG-4000 |
2200 |
1:50 |
942.865 |
42.857 |
|
|
V |
VCR |
PEG-4000 |
2200 |
1:100 |
855.488 |
38.886 |
|
|
I |
VLB |
PEG-4000 |
2000 |
1:10 |
907.674 |
45.384 |
SD = 7.003
ξ= 42.228 % |
|
II |
VLB |
PEG-4000 |
2000 |
1:20 |
1000.639 |
50.032 |
|
|
III |
VLB |
PEG-4000 |
2000 |
1:50 |
808.223 |
40.411 |
|
|
IV |
VLB |
PEG-4000 |
2000 |
1:100 |
776.890 |
38.844 |
|
|
V |
VLB |
PEG-400 |
2000 |
1:20 |
1117.146 |
55.857 |
E%, encapsulation efficiency.
Table 5. The encapsulation efficiency of TIAs into erythrocytes in an incubation medium contain DMSO
|
Probe № |
Drug name |
DMSO conc., mg/ml |
Added TIAs, µg |
Encapsulated TIAs, µg |
E% |
Metrological characteristics |
|
I |
VCR |
2 |
2200 |
1377.341 |
62.606 |
SD = 2.5821
ξ= 11.7540% |
|
II |
VCR |
2 |
2200 |
1254.739 |
57.034 |
|
|
III |
VCR |
2 |
2200 |
1325.765 |
60.262 |
|
|
IV |
VCR |
2 |
2200 |
1358.654 |
61.757 |
|
|
V |
VCR |
2 |
2200 |
1401.321 |
63.696 |
|
|
I |
VLB |
2 |
2200 |
1408.105 |
64.005 |
SD = 2.5288
ξ= 11.2618 % |
|
II |
VLB |
2 |
2200 |
1287.311 |
58.514 |
|
|
III |
VLB |
2 |
2200 |
1398.345 |
63.561 |
|
|
IV |
VLB |
2 |
2200 |
1423.908 |
64.723 |
|
|
V |
VLB |
2 |
2200 |
1349.087 |
61.322 |
conc., concentration; E%, encapsulation efficiency.
Table 6. The encapsulation efficiency of TIAs into erythrocytes in an incubation medium contain ATP
|
Probe № |
Drug name |
ATP conc., mg/ml |
Added TIAs, µg |
Encapsulated TIAs, µg |
E% |
Metrological characteristics |
|
I |
VCR |
2 |
2200 |
1001.8743 |
45.540 |
SD = 3.4161
ξ = 19.1435% |
|
II |
VCR |
2 |
2200 |
1053.6402 |
47.893 |
|
|
III |
VCR |
2 |
2200 |
1114.9395 |
50.679 |
|
|
IV |
VCR |
2 |
2200 |
1083.1154 |
49.233 |
|
|
V |
VCR |
2 |
2200 |
1203.3340 |
54.697 |
|
|
I |
VLB |
2 |
2200 |
936.6816 |
42.576 |
SD = 4.7126
ξ= 26.6129 % |
|
II |
VLB |
2 |
2200 |
1224.9609 |
55.680 |
|
|
III |
VLB |
2 |
2200 |
1072.9837 |
48.772 |
|
|
IV |
VLB |
2 |
2200 |
1115.0303 |
50.683 |
|
|
V |
VLB |
2 |
2200 |
1065.4529 |
48.430 |
conc., concentration; E%, encapsulation efficiency.

Figure 6. TIAs encapsulation efficiency under the different condition: (a) Freshly Isolated erythrocytes and erythrocytes after the storage period at +4°C; (b) In modified incubation medium with ATP compared to unmodified; (c) In modified incubation medium with DMSO compared to unmodified medium; (d) In modified incubation medium with PEG compared to unmodified medium.
Optical-microscopic studies have shown that the TIAs encapsulation into erythrocytes was accompanied by unexpressed changes in erythrocytes. In this study established that the diameter of the TIAs loaded erythrocytes decreases by ~1.0-1.5 μm compared to the control erythrocytes, while the average values were found: d = 7.269±0.460 μm and 8.553±0.624 μm (P<0.05) for loaded and unloaded erythrocytes, respectively (Figure 7). Using the turbidity spectrum method, the diameter of the control erythrocytes was determined: d – 8.454±0.119 μm and TIAs encapsulated erythrocytes d – 7.433±0.479 µm (P<0.05). The results obtained by the turbidity spectrum method and the optical microscopy method approximately coincide, and it confirms the authenticity of the obtained results.

Figure 7. Graphical representation of the diameter changes of TIAs loaded and control erythrocytes (n-100).

Figure 8. Optical microscopic image (400X digital zoom). Left – control erythrocyte; Right – TIAs loaded erythrocytes.
Physicochemical properties of TIAs encapsulated erythrocyte and control erythrocytes were studied. In the comparative analysis of physicochemical parameters of TIAs encapsulated and control erythrocytes, were established the index of relative refraction (m) of control erythrocytes – 1.110±0.0001, and TIAs encapsulated erythrocytes – 1.115±0.001 (P>0.05). The absolute refractive index of the control erythrocytes (μery) was 1.482±0.0005, meanwhile, TIAs encapsulated erythrocytes – 1.489±0.001 (P>0.05). The calculated concentration of erythrocytes (N) in the control sample was 6.070±0.010 ×107 cm-3, and for TIAs encapsulated erythrocytes sample – 7.570±2.050 ×107 cm-3 (P>0.05) respectively (Table 6a).
Table 6a. Physicochemical parameters of TIAs encapsulated erythrocytes
|
Physicochemical parameters of erythrocytes |
Control erythrocytes |
TIAs encapsulated erythrocytes |
||
|
Ery-TIAs-PEG 1:20* |
Ery-VCR |
Ery-VLB |
||
|
μme-buffer |
1.335 |
1.335 |
1.335 |
1.335 |
|
λ (wave length), nm |
660 |
660 |
660 |
660 nm |
|
Equations of the approximating curve in dependence lgG - lgl |
y = 1.246x – 3.256 |
y = 1.426x – 3.760 |
y = 1.209x – 3.151 |
y = 1.209x – 3.151 |
|
Equations of the approximating curve in dependence, |
y = -0.094x + 1.482 |
y = -0.097x + 1.488 |
y = -0.102x + 1.493 |
y = -0.099x + 1.489 |
|
μery |
1.482 ± 0.0004 |
1.488 |
1.489 |
1.489 |
|
m |
1.110 ± 0.0001 |
1.115 |
1.115 |
1.116 |
|
n |
1.2461 |
1.4256 |
1.209 |
1.224 |
|
α |
11.8 |
10.6 |
11.0 |
11.0 |
|
r ̅ , µm |
4.227 ± 0.060 |
3.793 |
3.763 |
3.749 |
|
Diameter (d), µm |
8.454 ± 0.119 |
7.586 |
7.526 |
7.498 |
|
Density of erythrocytes, ρ = 1+1.5 (m-1), g/сm3 |
1.165 ± 0.0001 |
1.170 |
1.173 |
1.173 |
|
Concentration of erythrocytes in 1 cm3 |
6.070 ± 0.010 ×10⁷ |
9.070 ×10⁷ |
6.751 ×10⁷ |
7.558 ×10⁷ |
|
7.570 ± 2.050 ×10⁷ |
||||
|
Concentration of dry substance: C% = 605.0 (m-1) |
66.481 ± 0.264 |
69.454 |
69.611 |
69.878 |
|
Content of dry matter in the erythrocyte, pg: CDM(pg) = 3.15 (m-1)d3 |
209.175 ± 8.952 |
157.873 |
143.062 |
153.332 |
|
Water in erythrocyte, %: Cw =100-0.75 С% |
50.139 ± 0.044 |
47.910 |
47.792 |
47.592 |
|
EMPI |
1.326± 0.002 |
1.449 |
1.457 |
1.469 |
|
1.45791 ± 0.02487 |
||||
|
MCV |
82.372 |
82.690 |
74.063 |
66.155 |
|
VRBC |
81.892 |
82.246 |
73.643 |
65.769 |
|
SARCB |
188.698 |
176.378 |
166.480 |
157.667 |
|
SARCB/VRBC |
2.306 |
2.145 |
2.261 |
2.397 |
* Added diluted cell suspension volume into Ery-TIAs-PEG tube – 0.015 ml.
The permeability of erythrocyte membranes was studied based on the occurred variations of three physicochemical parameters: concentration (%) and content of the dry substance in erythrocyte (pg) and water content in erythrocyte. In this research, to assess the permeability disturbances of erythrocyte membranes, we proposed an erythrocyte membranes permeability index (EMPI), which is formulated as the ratio of the water content in erythrocyte (Cw) to the concentration of dry matter in the erythrocyte (C%). The calculated EMPI of control erythrocytes was 1.326±0.002, and in TIAs encapsulated erythrocytes an average EMPI value 1.458±0.025 (P>0.05) respectively (Figures 9 and 10). Also, in the calculated data, it can be seen VRBC of encapsulated erythrocyte have been decreased approximately ~20% to the maximum from the control erythrocytes. Herewith, volume of an encapsulated erythrocyte in the incubation medium with PEG was shown fairly closer value compare to the control erythrocyte, as noticed volume of the encapsulated erythrocytes in the modified incubation medium with PEG was 82.245 fl and the control erythrocytes – 81.892 fl respectively, and a minimum volume of erythrocyte noticed with VLB encapsulated erythrocytes as VRBC – 65.769 fl. It can be noticed in Table 6a, the water content in the erythrocyte after the encapsulation process was decreased 1.5-2.5% than the control erythrocytes (Cw – 50.139±0.044%).

Figure 9. Physicochemical parameters of TIAs encapsulated and control erythrocytes.

Figure 10. Observed and calculated erythrocyte volumes, EMPI, SA/V parameters in different TIAs encapsulated and control erythrocytes.

Figure 11. The Hemolysis index of different type of TIAs loaded erythrocytes.
Table 7. Hemolysis index of different type of TIAs loaded erythrocytes
|
Conc. NaCl, % |
Hemolysis index K(Hb), % |
|||
|
Control Ery |
Type of TIAs encapsulated erythrocytes |
|||
|
TIA-Ery |
Ery-TIA-PEG |
Ery-TIA-DMSO |
||
|
0.1 |
100 |
100 |
100 |
100 |
|
0.2 |
95.322 |
99.171 |
94.859 |
96.277 |
|
0.3 |
80.263 |
89.589 |
87.543 |
89.176 |
|
0.4 |
29.349 |
66.607 |
62.871 |
66.046 |
|
0.5 |
13.670 |
33.465 |
31.953 |
32.506 |
|
0.6 |
5.300 |
24.352 |
23.085 |
23.578 |
|
0.65 |
4.240 |
15.166 |
14.700 |
14.891 |
|
0.7 |
3.582 |
7.061 |
6.832 |
6.963 |
|
0.8 |
3.107 |
5.548 |
5.383 |
5.481 |
|
0.9 |
1.118 |
4.035 |
3.761 |
3.861 |
conc., concentration; Ery, erythrocytes.
Table 8. Chronological In vitro drug release (Vincristine sulfate) during individual period
|
Incubation period, t(min) |
In vitro drug release (Vincristine sulfate) |
||||
|
m (VCR), µg |
m (VCR:PEG-4000 – 1:5), µg |
m (VCR: PEG-4000 – 1:10), µg |
m (VCR:PEG-4000 – 1:20), µg |
m (VCR:DMSO – 2 mg/ml), µg |
|
|
5 |
8.147 ± 1.883 |
32.380 ± 6.837 |
24.141 ± 4.479 |
28.543 ± 6.48 |
26.557 ± 6.643 |
|
10 |
39.448 ± 7.359 |
32.308 ± 8.356 |
31.807 ± 4.457 |
31.216 ± 6.753 |
73.934 ± 10.717 |
|
20 |
52.861 ± 3.611 |
40.128 ± 6.651 |
37.827 ± 8.148 |
45.010 ± 5.274 |
78.150 ± 10.301 |
|
40 |
132.337 ± 6.274 |
93.428 ± 2.993 |
42.842 ± 6.721 |
54.099 ± 10.454 |
82.070 ± 5.211 |
|
60 |
163.451 ±13.392 |
162.551 ± 9.222 |
145.534 ± 9.112 |
97.900 ± 17.764 |
86.814 ± 6.836 |
|
120 |
46.976 ± 12.985 |
40.321 ±4.063 |
84.127 ± 5.357 |
120.113 ± 8.768 |
171.463 ± 5.87 |
|
240 |
64.244 ± 11.15 |
95.866 ± 8.410 |
97.693 ± 8.621 |
135.809 ± 4.73 |
141.712 ±13.168 |
|
360 |
62.464 ± 9.011 |
94.565 ± 5.430 |
129.687 ± 9.879 |
78.880 ± 8.407 |
86.307 ± 8.938 |
m, mass. Data presented as mean with standard deviation - M±SD.
Table 9. Cumulative drug released of VCR from the loaded erythrocytes
|
Incubation period, t(min) |
Total amount of released drug (Vincristine sulfate) |
||||
|
VCR, %* |
VCR:PEG-4000 – 1:5, %* |
VCR:PEG-4000 – 1:10, %* |
VCR:PEG-4000 – 1:20, %* |
VCR:DMSO – 2 mg/ml, %* |
|
|
5 |
0.828 |
2.720 |
1.632 |
1.929 |
1.928 |
|
10 |
4.840 |
5.433 |
3.782 |
4.039 |
7.296 |
|
20 |
10.215 |
8.803 |
6.339 |
7.082 |
12.970 |
|
40 |
23.672 |
16.650 |
9.235 |
10.739 |
18.929 |
|
60 |
40.293 |
30.301 |
19.072 |
17.356 |
25.232 |
|
120 |
45.069 |
37.337 |
24.759 |
25.475 |
37.680 |
|
240 |
48.179 |
45.389 |
31.362 |
34.655 |
47.969 |
|
360 |
54.531 |
53.331 |
40.128 |
39.987 |
54.235 |
* – Mean value (n=3), the represented value by percentage from encapsulated drugs amount.
Table 10. Chronological In vitro drug release (Vinblastine sulfate) during individual period
|
Incubation period, t(min) |
In vitro drug release (Vinblastine sulfate) |
||||
|
m (VLB), µg |
m (VLB:PEG-4000 – 1:10), µg |
m (VLB:PEG-4000 – 1:20), µg |
m (VLB:PEG-400 – 1:20), µg |
m (VLB:DMSO – 2 mg/ml), µg |
|
|
10 |
75.313 ± 6.457 |
76.625 ± 5.59 |
83.698 ± 3.106 |
146.442 ± 2.8 |
135.103 ± 4.418 |
|
20 |
64.911 ± 9.881 |
72.573 ± 3.898 |
87.983 ± 2.382 |
103.738 ± 2.651 |
100.521 ±5.093 |
|
40 |
144.229 ± 10.401 |
119.271 ± 3.494 |
81.656 ± 6.74 |
111.917 ± 8.950 |
108.190 ± 2.463 |
|
60 |
164.400 ± 8.721 |
160.628± 7.137 |
195.085 ± 7.234 |
100.776 ± 8.498 |
117.643 ± 6.584 |
|
120 |
100.476 ± 11.331 |
85.364 ± 4.622 |
80.661 ± 4.688 |
92.851 ± 8.141 |
188.943 ± 5.931 |
|
240 |
38.820 ± 6.392 |
78.787 ± 8.793 |
51.887 ± 3.555 |
85.963 ± 6.606 |
141.637 ± 3.657 |
|
360 |
29.678 ± 4.827 |
30.346± 1.799 |
26.872 ± 4.235 |
32.544 ± 3.835 |
116.200 ± 5.493 |
m, mass. Data presented as mean with standard deviation - M±SD.
Table 11. Cumulative drug released of VLB from loaded erythrocytes
|
Incubation period, t(min) |
Total amount of released drug (Vinblastine sulfate) |
||||
|
VLB, %* |
VLB:PEG-4000 – 1:5, %* |
VLB:PEG-4000 – 1:10, %* |
VLB:PEG-4000 – 1:20, %* |
VLB:DMSO – 2 mg/ml, %* |
|
|
10 |
8.2972 |
6.697 |
8.3645 |
11.589 |
9.595 |
|
20 |
15.4484 |
13.040 |
17.157 |
19.799 |
16.733 |
|
40 |
31.3381 |
23.465 |
25.318 |
28.656 |
24.417 |
|
60 |
49.4500 |
37.505 |
44.814 |
36.632 |
32.771 |
|
120 |
60.5194 |
44.966 |
52.875 |
43.980 |
46.190 |
|
240 |
64.7961 |
51.852 |
58.060 |
50.783 |
56.248 |
|
360 |
68.0656 |
63.894 |
60.746 |
60.353 |
64.501 |
* – Mean value (n=3), the represented value by percentage from encapsulated drugs amount.
ORE is an important indicator which was giving important information about the stability of red blood cells and their morphological and physicochemical properties; less stable erythrocytes begin to break down earlier than normal red blood cells in the hypotonic NaCl solution. Stability of erythrocytes varies with the morphological and physicochemical properties of erythrocytes. In Figure 11, it can be seen that the hemolysis index of TIAs encapsulated erythrocytes is slightly higher than the control erythrocytes, this indicates the occurred changes in morphological and physicochemical properties of TIAs encapsulated erythrocytes within the encapsulation process. According to the data can see TIAs encapsulated erythrocytes are hemolyzed approximately ~60% at a 0.40% NaCl solution, and the control erythrocyte ~30% in the same condition. Also in Figure 11, it is seen that the TIAs encapsulated erythrocytes in a modified incubation medium with PEG (TIA: PEG – 1:20) shows a slightly lower hemolysis index than in an unmodified incubation medium. It is also seen that the TIAs encapsulated erythrocytes in a modified incubation medium with PEG, shows a slightly higher expression of resistance, rather than erythrocytes, encapsulated in an unmodified incubation medium. Such observation indicates that PEG can stabilize and minimize cell membranes damages of red blood cells during the encapsulation process.
It is well known, that an increase in erythrocyte aggregation worsens blood flow in micro-vessels and oxygenation of tissues, contributes to the development of thrombosis and ischemia. Spontaneous aggregation of erythrocytes in autologous plasma was investigated by optical microscopy in the Goryaev chamber, determining the percentage of free (non-aggregated) cells in the suspension and the average aggregate size (Figure 12). In the microscopy study, it was established that the non-aggregating TIAs encapsulated erythrocytes was in average 56.71% and the control erythrocytes 58.44% from whole counted cells. The results were obtained do not deviate from the erythrocyte aggregation index in normal 40-60%.
Some additional data are presented in Tables 7-11.

Figure 12. Optical microscopic study of aggregation of erythrocytes in the “Goryaev chamber”: (a) Control erythrocytes; (b) TIAs loaded erythrocytes.
In vitro drug released from encapsulated erythrocytes were examined, and it was established VCR – 48.442±9.520% and VLB – 63.512±3.901% (P<0.05) from the encapsulated erythrocytes was released during 6 hours at 37°C. In Figures 13 and 14 can be seen after 1h drug released from the encapsulated erythrocytes were maintaining approximately constant drug release during few hours. Moreover, also shows that the slow drug release from the erythrocyte encapsulated in the modified incubation medium with PEG and DMSO than the encapsulated in the unmodified medium. The drug release constant (k) and regression coefficient (R²) calculated using first order, zero order, and Higuchi models are shown in Figure 15, and the drug release kinetics indicated that drug release from encapsulated erythrocytes was best supported by Higuchi’s equation, as it presented the highest linearity (R2), but a close relationship was also prominent with zero-order kinetics (R2) (Table 12).

Figure 13. In vitro drug release from VCR loaded erythrocytes at 37°C.

Figure 14. In vitro drug release from VLB loaded erythrocytes at 37°C.

Figure 15. Kinetic models graph along with trend lines.
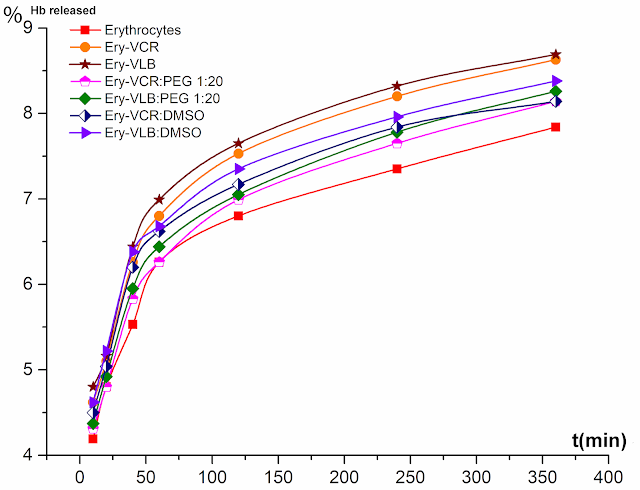
Figure 16. In vitro hemoglobin release (%) from the control and drug-loaded erythrocytes.
Table 12. Values of release rate constant “k” and correlation coefficient “R2” of loaded erythrocytes
|
Drug released model |
Type of the TIAs encapsulated erythrocytes |
|||||
|
VCR |
VCR: PEG 4000 – 1:5 |
VCR: PEG 4000 – 1:10 |
VCR: PEG 4000 – 1:20 |
VCR: DMSO – 2 mg/ml |
||
|
Zero order: Qt = Q0 + K0t |
R2 |
0.689 |
0.839 |
0.903 |
0.910 |
0.875 |
|
k0 |
0.152 |
0.978 |
0.752 |
0.997 |
1.356 |
|
|
First order: log C = log C0 – (Kt/2.303) |
R2 |
0.418 |
0.598 |
0.546 |
0.638 |
0.654 |
|
kt |
0.003 |
0.003 |
0.003 |
0.003 |
0.003 |
|
|
Higuchi model: Q= KH* t1/2 |
R2 |
0.851 |
0.950 |
0.976 |
0.988 |
0.977 |
|
kH |
3.256 |
3.127 |
2.313 |
2.370 |
3.144 |
|
|
|
|
VLB
|
VLB: PEG 4000 – 1:10 |
VLB: PEG 4000 – 1:20 |
VLB: PEG 400- 1:20 |
VLB: DMSO – 2 mg/ml |
|
Zero order: Qt = Q0 + K0t |
R2 |
0.672 |
0.824 |
0.689 |
0.836 |
0.877 |
|
k0 |
0.189 |
0.939 |
0.951 |
0.994 |
1.069 |
|
|
First order: log C = log C0 – ( Kt/2.303) |
R2 |
0.514 |
0.602 |
0.536 |
0.648 |
0.693 |
|
kt |
0.002 |
0.002 |
0.002 |
0.002 |
0.002 |
|
|
Higuchi model: Q= KH* t1/2 |
R2 |
0.826 |
0.930 |
0.838 |
0.941 |
0.970 |
|
kH |
3.771 |
3.287 |
3.456 |
3.449 |
2.856 |
|
Table 13. Hemoglobin release from the TIAs loaded erythrocytes in vitro
|
Incubation period, minutes |
Released hemoglobin |
||||||
|
Un-encapsulated erythrocytes, %** |
Ery-VCR, % |
Ery-VLB, % |
Ery-VCR: PEG 4000 1:20, % |
Ery-VLB: PEG 4000 1:20, % |
Ery-VCR-DMSO, % |
Ery-VLB-DMSO, % |
|
|
10 |
4.80 |
5.22 |
5.41 |
4.92 |
4.98 |
5.1 |
5.22 |
|
20 |
5.41 |
5.71 |
5.77 |
5.41 |
5.53 |
5.65 |
5.83 |
|
40 |
5.89 |
6.26 |
6.44 |
5.83 |
5.95 |
6.2 |
6.38 |
|
60 |
6.26 |
6.8 |
6.99 |
6.26 |
6.44 |
6.62 |
6.68 |
|
120 |
6.62 |
7.35 |
7.47 |
6.62 |
6.8 |
7.17 |
7.35 |
|
240 |
7.17 |
7.96 |
8.2 |
7.35 |
7.47 |
7.84 |
7.96 |
|
360 |
7.53 |
8.44 |
8.69 |
7.84 |
7.96 |
8.14 |
8.38 |
* Absorption value of the erythrocytes hemolysate after the complete hemolysis – 1.646. ** Average value (n=3), SD – (± 0.04~0.12).
The results presented in Table 13 and Figure 16, was shown that the release of hemoglobin from TIA encapsulated erythrocytes compared to nonencapsulated erythrocytes is not that much vary from each other’s, and it confirms that the occurred disturbance of the integrity of red blood cells during the encapsulation process was minimal. However, it can be seen that hemoglobin – 8.242±0.314% was released from the TIAs encapsulated erythrocytes compared to control erythrocytes – 7.530±0.092%, after 6 h incubation at 37°C. At the same time, it is clear that the release of hemoglobin from TIAs encapsulated erythrocytes in a modified medium is less than encapsulated in an unmodified medium.
In the experiment results (Tables 13 and 14), it can be seen the noticeable stability of TIAs encapsulated erythrocytes were stored in the Na-Phosphate buffer at +4°C, according to that, can concluded it was an optimal condition for the storage of TIAs loaded erythrocytes (Figures 17 and 18). During the period of storage, the encapsulated TIAs drugs in loaded erythrocytes have been varying; it was found that after 3 days, the TIAs content in the mean value – 98.535%, after 7 days – 95.964%, and after 14 days – 24.780% compared to the encapsulated drug amount (Figure 19).
Table 14. The remains encapsulated TIAs drugs amount in the erythrocytes after storage period at +4°C
|
Type of the TIAs encapsulated erythrocytes |
Encapsulated TIAs drugs amount (mean), µg |
Storage period, days |
|||
|
1 |
3 |
7 |
14 |
||
|
Remains drugs amount after the storage period in the erythrocytes, %* |
|||||
|
VCR-Ery I |
873.475 |
99.109 |
- |
- |
- |
|
VCR-Ery II |
846.866 |
- |
98.180 |
- |
- |
|
VCR-Ery III |
859.277 |
- |
- |
95.314 |
- |
|
VCR-Ery IV |
893.068 |
- |
- |
- |
20.985 |
|
VCR-PEG-1:20 I |
1078.869 |
99.011 |
- |
- |
- |
|
VCR-PEG -1:20 II |
1026.908 |
- |
98.927 |
- |
- |
|
VCR-PEG -1:20 III |
1059.131 |
- |
- |
97.502 |
- |
|
VCR-PEG -1:20 IV |
1024.685 |
- |
- |
- |
29.913 |
|
VCR-DMSO I |
1246.908 |
99.194 |
- |
- |
- |
|
VCR-DMSO II |
1179.731 |
- |
98.721 |
- |
- |
|
VCR-DMSO III |
1248.668 |
- |
- |
97.059 |
- |
|
VCR-DMSO IV |
1206.786 |
- |
- |
- |
23.657 |
|
VLB-Ery I |
891.733 |
99.288 |
- |
- |
- |
|
VLB-Ery II |
871.727 |
- |
98.193 |
- |
- |
|
VLB-Ery III |
911.738 |
- |
- |
95.969 |
- |
|
VLB-Ery IV |
906.678 |
- |
- |
- |
21.313 |
|
VLB-PEG 1:20 |
1057.178 |
99.013 |
- |
- |
- |
|
VLB-PEG 1:20 |
1091.378 |
- |
98.695 |
- |
- |
|
VLB-PEG 1:20 |
1089.116 |
- |
- |
97.376 |
- |
|
VLB-PEG 1:20 |
1096.543 |
- |
- |
- |
28.990 |
|
VLB-DMSO |
1291.731 |
98.950 |
- |
- |
- |
|
VLB-DMSO |
1269.173 |
- |
98.494 |
- |
- |
|
VLB-DMSO |
1209.156 |
- |
- |
97.190 |
- |
|
VLB-DMSO |
1245.867 |
- |
- |
- |
23.941 |
*The remains drugs in the erythrocytes was presented by percentage of encapsulated drug amount.

Figure 17. The hemolysis index of TIAs encapsulated erythrocytes stored under different conditions. T – stored temperature (°C). Erythrocytes stored during 1, 3 and 6 days under different temperature conditions.

Figure 18. The hemolysis index of TIA encapsulated erythrocytes during the storage period at +4°C. t – storage period (weeks).

Figure 19. Graphical representation remains encapsulated TIAs drug amount after the storage period at +4°C.
Discussion
According to observations getting from the carried out experiments with isolated human erythrocytes, it can be concluded that used freshly isolated erythrocytes can be increased TIAs encapsulation into erythrocytes. However, modified pre-swelling hypotonic lysis method did not allow to achieve fair TIAs encapsulation efficiency with freshly isolated erythrocytes. For the purposes of achieving to higher efficacy of encapsulation was developed a new encapsulation technique to increase the TIAs encapsulation efficiency based on the osmatic presser gradient through intra and extracellular matrix of erythrocytes and was achieved ~15–20% improvement of TIAs encapsulation efficacy. Based on the results, it can be concluded that the encapsulate TIAs drugs into erythrocytes applying hypotonic lysis method in the modified incubation medium, TIA: PEG – 1:20 (w/w) is optimal concentration ratio for prepare TIAs encapsulated erythrocytes. The achieving to higher TIAs encapsulation efficiency was depended on the presence of PEG-4000, PEG-400, and DMSO in the incubation medium. In an unmodified medium (in the absence of an aprotic solvent, and PEG), the loading efficiency of VCR and VLB was 42.963±2.648% and 44.266±2.432%, respectively. In a modified incubation medium containing DMSO (2 mg/ml), was demonstrated in a statistically significant increase of drug inclusion into erythrocytes – up to 61.071±3.2102% for VCR and 62.425±3.14% for VLB (P<0.05).
In the carried out experiments were found some changes of physicochemical indices of TIAs encapsulated erythrocytes and control erythrocytes, such as EMPI, ρ, C%, Cw (Figure 9). The occurred physicochemical changes on erythrocytes can affect to the life cycle of TIAs encapsulated erythrocytes in the human body. According to the results (Table 6), it can be seen that in the encapsulation process, the erythrocyte membrane permeability was increased, this observation can be confirm the calculated values of the EMPI of control erythrocytes 1.326±0.002, and TIAs encapsulated erythrocytes 1.458±0.025 (P<0.05). Moreover, also seen the erythrocytes, encapsulated in the modified incubation medium contain PEG (TIA:PEG – 1:20), have shown less EMPI than encapsulated in an unmodified environment. Some of the research carried out by different researchers confirmed, PEG can be reduced erythrocyte aggregation and has the ability to mask epitopes antigens in the cell membrane. Also, PEG provides reliable protection against the effects of extreme environmental factors and minimizes damage can occur to cell membranes. Additionally, the results were collected in this study, have confirmed that research evidence. Based on the results of physicochemical indices of TIAs encapsulated erythrocytes, we can suggest a hypothesis that the containing PEG in the incubation medium can stabilize and restores erythrocyte membranes at the TIAs encapsulation process. Therefore, the erythrocytes were recovered after the resealing with a good morphological and physicochemical indices: in diameter ~85.67%, VRCB/VSA – ~98.33%, EMPI – 9.95% (Figure 10), and those parameters are relatively good compared to control erythrocytes, according to these observations can make conclusion, in this experiment TIAs encapsulated erythrocytes was obtained with minimal erythrocytes integrity damages.
The based on results, the determination of the aggregation capacity of erythrocytes after TIAs encapsulation can suggest that the reinfusion TIAs encapsulated erythrocytes would not have a negative effect on microcirculatory processes in the body. In the conducted in vitro experiments were noticed over ~50% drug released from the TIAs loaded erythrocytes during 6h at 37°C, and drug release kinetics indicated that drug release was best supported by Higuchi’s model. Besides, as a drug delivery system TIAs encapsulated erythrocytes were shown fairly good in vitro drug released curve (Figures 13-15). In the results, it can be seen that the average drug release rate from the loaded erythrocytes which were encapsulated in the medium containing PEG is approximately close to each other’s. According to, this kind of observation can make conclusion, the PEGs have ability to maintain the erythrocyte membrane stability and the cell shape during the encapsulation process. During the storage, the content of TIAs in loaded erythrocytes was reducing continuously; it was established that after 3 days, the TIAs content in the mean value ~98.535%, after 7 days 95.964%, and after 14 days 24.780% from the encapsulated drug amount. The most likely associated cause may be higher damage caused by the cell membrane integrity and cells deformation during the storage period.
Conclusion
Based on the conducted analysis, it can be concluded that the TIAs encapsulation into erythrocytes has been successful with good encapsulation efficiency. The stability and functionality of TIAs loaded erythrocytes was demonstrating relatively good performance with comparison to control erythrocytes and can be suggested to conduct in vivo experiment in animals to determine the therapeutic potential compared to the free drug forms. The storage period and conditions for isolated erythrocytes were determined as 7 days at +4°C in Na-Phosphate buffer (pH 7.4) with 3% dextran, and VCR and VLB encapsulated erythrocytes - no more than 3 days at +4°C. In the long term, it is possible to prolong the storage period of VCR and VLB encapsulated erythrocyte after freeze-drying up to 6 months as a lyophilisate of TIAs encapsulated erythrocytes.
Acknowledgement
This study would not have been possible unless we couldn’t get help from Department of Pharmaceutical Chemistry and Pharmaceutical technology and Department of Pharmacology at Voronezh State University (Voronezh, Russia). These departments provided us with all equipment and materials to complete this task.
Conflict of Interest
The authors declare that they have no conflict of interest.
Ethical Approval
This article does not contain any studies with human participants or animals performed by any of the authors.
- Nicole C, Farnaes L. The Vinca Alkaloids. In: Cancer Management in Man: Chemotherapy, Biological Therapy, Hyperthermia and Supporting Measures. B. Minev, ed. Cancer Growth and Progression. Dordrecht: Springer Science, 2011; vol. 13: 25-37. https://doi.org/10.1007/978-90-481-9704-0_2.
- Volkov SK. Medicinal plants method of analysis of some antitumor-active alkaloids from Catharanthus roseus. Pharm Chem J 1996; 30(6): 391–399. https://doi.org/10.1007/BF02219327.
- Krishna R, Webb MS, St. Onge G, Mayer LD. Liposomal and nonliposomal drug pharmacokinetics after administration of liposome-encapsulated vincristine and their contribution to drug tissue distribution properties. J Pharmacol Exp Ther 2001; 298(3): 1206–1212. https://www.ncbi.nlm.nih.gov/pubmed/11504822.
- Tuscano JM, Martin SM, Ma Y, Zamboni W, O’Donnell RT. Efficacy, biodistribution, and pharmacokinetics of CD22-targeted pegylated liposomal doxorubicin in a B-cell non-Hodgkin’s lymphoma xenograft mouse model. Clin Cancer Res 2010; 16(10): 2760–2768. https://doi.org/10.1158/1078-0432.CCR-09-3199.
- Babu A, Templeton AK, Munshi A, Ramesh R. Nanoparticle-based drug delivery for therapy of lung cancer: progress and challenges. J Nanomater 2013; 2013: 1–11. https://doi.org/10.1155/2013/863951.
- Rahi A, Sattarahmady N, Heli H. Toxicity of nanomaterials-physicochemical effects. Austin J Nanomedicine Nanothechnology 2014; 2(6): id1034. http://austinpublishinggroup.com/nanomedicine-nanotechnology/fulltext/ajnn-v2-id1034.pdf.
- Khan HA, Shanker R. Toxicity of nanomaterials. Biomed Res Int 2015; 2015: 521014. https://doi.org/10.1155/2015/521014.
- Clichici S, Filip A. In vivo assessment of nanomaterials toxicity. In: Nanomaterials – toxicity and risk assessment. K. Pesek, ed. InTech, 2015: 93–122. https://doi.org/10.5772/60707.
- Venkatesh E, Aparna C, Umasankar K. Resealed erythrocytes: a novel approach to treat chronic diseases. Int J Pharm Sci Rev Res 2013; 23(2): 298–306. http://globalresearchonline.net/journalcontents/v23-2/48.pdf.
- Ihler GM, Glew RH, Schnure FW. Enzyme loading of erythrocytes. Proc Natl Acad Sci 1973; 70(9): 2663–2666. https://doi.org/10.1073/pnas.70.9.2663.
- Jangde R. An Overview of resealed erythrocyte for cancer therapy. Asian J Res Pharm Sci 2011; 1(4): 83–92. http://www.asianpharmaonline.org/ajps/1_ajps_1_4_2011.pdf.
- Hamidi M, Zarrin A, Foroozesh M, Mohammadi-Samani S. Applications of carrier erythrocytes in delivery of biopharmaceuticals. J Control Release 2007; 118(2): 145–160. https://doi.org/10.1016/j.jconrel.2006.06.032.
- Villa CH, Anselmo AC, Mitragotri S, Muzykantov V. Red blood cells: Supercarriers for drugs, biologicals, and nanoparticles and inspiration for advanced delivery systems. Adv Drug Deliv Rev 2016; 106: 88–103. https://doi.org/10.1016/j.addr.2016.02.007.
- Xu P, Wang R, Wang X, Ouyang J. Recent advancements in erythrocytes, platelets, and albumin as delivery systems. Onco Targets Ther 2016; 9: 2873. https://doi.org/10.2147/OTT.S104691.
- Sah AK, Rambhade A, Ram A, Jain SK. Resealed erythrocytes: a novel carrier for drug targeting. J Chem Pharm Res 2011; 3(2): 550–565. http://www.jocpr.com/articles/resealed-erythrocytes-a-novel-carrier-for-drug-targeting.pdf.
- Muzykantov VR. Drug delivery by red blood cells: vascular carriers designed by mother nature. Expert Opin Drug Deliv 2010; 7(4): 403–427. https://doi.org/10.1517/17425241003610633.
- Pierigè F, Serafini S, Rossi L, Magnani M. Cell-based drug delivery. Adv Drug Deliv Rev 2008; 60(2): 286–295. https://doi.org/10.1016/j.addr.2007.08.029.
- Kim Y, Kim K, Park Y. Measurement techniques for red blood cell deformability: recent advances. In: Blood cell – an overview of studies in hematology. InTech, 2012: 167–194. https://doi.org/10.5772/50698.
- Ross MH, Pawlina W. Blood. In: Ross MH, Pawlina W, editors. A text and atlas: with correlated cell and molecular biology, 6th Edition. Wolter Kluwer, 2011: 270–313. http://www.lww.co.uk/histology-a-text-and-atlas-content.
- Gupta A, Mishra AK, Bansal P, Kumar S, Gupta V, Singh R, et al. Cell based drug delivery system through resealed erythrocyte - a review. Blood Cells 2010; 2(1): 23–30. http://oaji.net/articles/2014/364-1394392901.pdf.
- Zocchi E, Tonetti M, Polvani C, Guida L, Benatti U, De Flora A. Encapsulation of doxorubicin in liver-targeted erythrocytes increases the therapeutic index of the drug in a murine metastatic model. Proc Natl Acad Sci USA 1989; 86(6): 2040–2044. https://www.ncbi.nlm.nih.gov/pubmed/2928317.
- Pitt E, Johnson CM, Lewis DA, Jenner DA, Offord RE. Encapsulation of drugs in intact erythrocytes: an intravenous delivery system. Biochem Pharmacol 1983; 32(22): 3359–3368. https://doi.org/10.1016/0006-2952(83)90363-5.
- Sprandel U, N. Zollner. Osmotic fragility of drug carrier erythrocytes. Res Exp Med 1985; 185(1): 77–85. https://doi.org/10.1007/BF01851531.
- Singh SK, Yadav SK, Kumar A, Pradesh U. Mechanism of drug loading , evaluation and applications of erythrocytes as carriers for drug targetting. Indian Journal of Research in Pharmacy and Biotechnology 1989; 1(1): 67–77. http://www.ijrpb.com/issues/Volume%201_Issue%201/ijrpb%201_15%20page%2067-77.pdf.
- Magnani M, DeLoach JR. The use of resealed erythrocytes as carriers and bioreactors. Boston, MA: Springer US, 1992; 341 p. https://doi.org/10.1007/978-1-4615-3030-5.
- Klenin V, Shchegolev SYu, Lavrushin V. Characteristic functions of dispersion of dispersion systems. Saratov, 1977; 177 p. http://www.twirpx.com/file/171699.
- Udroiu I. Estimation of erythrocyte surface area in mammals. arXiv.org, 2014: arXiv:1403.7660. http://arxiv.org/abs/1403.7660.
Received 29 October 2017, Revised 28 March 2018, Accepted 22 June 2018
© 2017, Jeewantha H.M.A., Slivkin A.I.
© 2017, Russian Open Medical Journal
Correspondence to Halahakoon Amila Jeewantha. Department of Pharmaceutical Chemistry and Pharmaceutical Technology, Voronezh State University, Studencheskya str., 3, Voronezh, 394620, Russia. E-mail: amilajh1982@hotmail.com.
