Introduction
Not only condition of internal organs define ones health but also their interactions in an overall functional system [1]. These interactions can be estimated from the quantitative indices characterizing the structure and strength of couplings between the elements of the system. There are several approaches to estimation of strength and direction of coupling for complex oscillatory systems [2-4]. The diagnostics of interaction between various physiological processes in humans is carried out using time series of different biological signals (electrocardiogram, electroencephalogram, myogram, etc). Many of such signals can be recorded noninvasively that simplifies the possibility of their analysis in clinical practice. In recent decades new knowledge has been obtained about the functioning of different elements of human cardiovascular system (CVS). In particular, it was shown that measurements of phase synchronization between the low-frequency rhythms (with a frequency of about 0.1 Hz) in heart rate variability (HRV) and photoplethysmogram (PPG) signal can help in choosing the more efficient therapeutic approach for treatment of several CVS diseases [5, 6]. However, it is important to apply other quantitative measures for studying the features and structure of couplings between different physiological processes especially in the cases of intensive therapy and reanimation.
Earlier it was demonstrated in [7-12] that different anesthetic drugs have different impacts on sympathetic and parasympathetic control of heart rate and arterial pressure. During the choice of a therapy it is important to take into account the patient’s circulation conditions. In the study [13], the synchronization between the heart rate and respiration was examined before and during general anesthesia and it was shown that the synchronization index is lower during the anesthesia. In the study [14], the coupling characteristics were estimated for the low-frequency rhythms of electroencephalogram (EEG) and cardiovascular signals under the effect of different anesthetic drugs. However, the features of interaction (strength and direction) are yet to be studied for the rhythms of autonomic control of heart rate and vascular tone under anesthesia. It hinders the prognosis and preventive treatment of potential hemodynamic complications especially under the spinal anesthesia.
The aim of study is to investigate the characteristics of coupling between the rhythms of autonomic control of heart rate and peripheral blood filling (from PPG data) under the ataractanalgesia and spinal block.
Material and methods
Patients
17 women (age 30-40) underwent the prospective randomized evaluation while in gynecology care after minor gynecological surgeries. The patients were separated into two groups according to the anesthesia type. For both groups, pretreatment included benzodiazines administration before bed (seduxen 5 mg per os) and 60 minutes before surgery (seduxen 10 mg intravenously). The pretreatment was conducted on surgery table with intravenous administration of atropine (0.01 mg per kg), seduxen (0.1-0.15 mg per kg) and fentanyl (1-2 µg per kg). Anesthesia was induced by intravenous administration of atracurium besilate (0.5-0.6 mg per kg). The patients then underwent tracheal intubation and put into in the CMW regime (Dräger machine, Germany). General anesthesia in the first group of the patients was archived according to the ataractanalgesia concept with administration of seduxen (0.5 mg per kg) and fentanyl (0.05-0.2 µg per kg). The second group underwent surgery under the spinal anesthesia – bupivicaine 0.5% (4 ml), puncture in L3-L4 level. Myoplegia was achieved with administration of atracurium besylate (50 mg). Anesthesia continued from 60 to 90 minutes.
Registration of biological signals
Single channel II standard lead ECG and three PPG channels (earlobe PPG (PPGear), ring finger PPG (PPGfinger), and second right toe (PPGtoe)) were sampled at a frequency of 250 Hz with the standard electroencephalograph analyzer EEGA-21/26 ‘Encephalan-131-03’ (Medicom MTD Ltd, Taganrog, Russia). The data were registered from the patients without cardiovascular diseases under three different conditions: (i) day before the operation in resting supine position; (ii) during the main stage of the operation under the spinal anesthesia; and (iii) during the main stage of the operation under the ataractanalgesia; Typical signals are shown in Figure 1. Lines on the figure seem continuous but in fact consist of dots separated by ∆t = 4 ms which correspond to moments tn = nΔt, where n = 1, 2, 3, … N is a discrete time. The values x in those moments (numerical sequence x(1), …, x(N)) we will name as the time series and will write as {xn}, were N is the series length.

Figure 1. The typical ECG and PPG signals: а) ECG; b) PPGear; c) PPGfinger; d) PPGtoe. The indications x(ti) of measuring devices recorded at the moments tn = nΔt, where n = 0, 1, 2, … N, are shown in arbitrary units in vertical axis.
Processing of biological data
From the registered signals we extracted the sections without artifacts, high noise and interference. The time intervals between ECG R-spikes were calculated form heart rate variability signal (HRV). The low-frequency (0.05-0.15 Hz) rhythms in HRV are assumed to reflect the dynamics of heart rate autonomic control, while the low-frequency rhythms in PPG reflect the dynamics of vascular tone autonomic control [15, 16]. The obtained HRV and PPG signals were then filtered with band-pass filter (0.05-0.15 Hz) and analyzed for the presence of coupling.
Data analysis
There are a number of approaches to coupling detection from time series [17, 18]. The most widespread among them are cross-correlation and cross-spectra. However, they can’t determine the direction of coupling, i.e. to define whether the coupling between the systems is unidirectional or bidirectional, and to reveal the direction of coupling in the case of unidirectional interaction. The direction of coupling between a master system, lets refer to it as X, and a slave system Y can be determined with methods of nonlinear dynamics from time series of studied systems {xn} and {yn}. To do so two mathematical models are constructed. The first model is based solely on data from the time series {xn}, and the second model is constructed with addition of the data from time series {yn}, which is considered to be a driver. Then both models are used to predict future values of {xn} from the earlier data. The difference between predicted and real values of {xn} then calculated to estimate the precision of prediction and prognostic properties of the model. If addition of {yn} data to the first model leads to less prediction error, then the system Y is considered to be driving the system X.
This idea was originally implemented by 2003 Nobel Prize Winner in Economics C. Granger [3]. It can be illustrated with predictive models in terms of point maps (difference equations):
xn+m = f1(xn, xn-1, …xn-k), (1)
xn+m = f2(xn, xn-1, …xn-k, yn-d, yn-d-1,... yn-d-u), (2)
where f1,2 are the functions of x, which coefficients are chosen for the best possible precision of the prediction. The subscript indices correspond to the number of points in the time series, for example, n=1,2,3,… is the discrete time, m is the prediction interval, and the index (n+m) corresponds to a point in future that is shifted by m samples from n. Indices d and u correspond to the values of time series {yn} used in the model (2).
We used the modified approach of coupling detection that is better suited for the aim of the study. From the sampled time series {xn} and {yn} we calculated the phases of oscillations {φx} and {φy}. We used the phases as characteristics of oscillations in cardio-vascular system because the phases are the most sensitive to changes in the systems parameters. It is apparent that such sensitivity could be perspective for early diagnosis of developing diseases including disorders in functional relationships.
From Figure 1 it is evident that experimental ECG and PPG are far from being sinusoidal signals, but they have a pronounced periodicity (rhythmic behavior). Therefore, the calculation of the oscillations phases is conducted via a projection into the phase space, and for the construction of a predictive model we used widespread differential equations (phase oscillator equations (3)) instead of the point maps (1) and (2). They provide adequate representation of phase dynamics of oscillating systems with defined main rhythm [19]:
dφ/dt = ω + F(φ), (3)
where ω is the oscillation frequency, F(φ) is the phase function specific to the studied system. For discrete time series, it is convenient to use difference form of equation (3) where infinitely small changes in phases dφ/dt are replaced by finite difference Δφ(t) ≡ φ(t+t) – φ(t) characterizing the phase increment at the finite time interval t. As t, a conditional period of oscillations is commonly used. For oscillation sources X and Y, the phase time series {φx} and {φy} are written as:
Δφx = F1(φx , φy) + εx,
Δφy = F2(φx , φy) + εy, (4)
where εx and εy are small random variables (zero mean uncorrelated Gaussian white noise) introduced to simulate realistic noises. For F, we used trigonometric polynomial functions. Thus, for the system X, the model has the following form:
F1(φx , φy) = wx + Σαm,n cos(mφx – nφy) + βm,n sin(mφx – nφy), (5)
where αm,n, βm,n are the coefficients estimated from the experimental data with least square fitting method to provide least possible difference between the experimental phase increment and the model results, m and n are integers, and w is the oscillation angular frequency. For the system Y model, one should interchange the subscripts x and y in equation (5).
The function F1(φx , φy) in equation (5) depends on the phases of both the first and second oscillators. Steepness of this dependence can be used to estimate the strength of directional coupling. Therefore, one can use formulae (6) (the coupling index) as a quantitative measure of coupling strength between a pair of oscillators:
 , (6)
, (6)
In our study the index (6) is used to measure coupling direction and strength between the elements of cardiovascular system [3, 20]. The influence of vascular tone regulation on the heart rate regulation we will denote as γ1, and the influence in the opposite direction we will denote as γ2. To assess the statistical significance of γ1 and γ2 we used the analytical formulae for 95% confidence intervals derived in [19].
Calculations of γ1 and γ2 were conducted for different time delays τ between HRV and PPG. Value of the delay τ represents the possible time delay in coupling (originating from finite speed of influence transmission or finite reaction time).
Results
Dependences of γ1,2 on τ calculated from the experimental time series of HRV and PPG for one of the subjects are presented in Figure 2 for the pre surgical data and in Figure 3 for the data recorded during the spinal anesthesia. The vertical tick marks represent pointwise 95% confidence interval. We consider coupling to be statistically significant for the time delays τ for which the vertical marks do not cross the horizontal red line at zero level.

Figure 2. Dependences of coupling indices γ1,2 on delay time τ for pre the surgical recordings: (а) influence of PPGear on HRV; (b) influence of HRV on PPGear; (c) influence of PPGfinger on HRV; (d) influence of HRV on PPGfinger; (e) influence of PPGtoe on HRV; (f) influence of HRV on PPGtoe. The vertical tick marks represent 95% confidence interval.
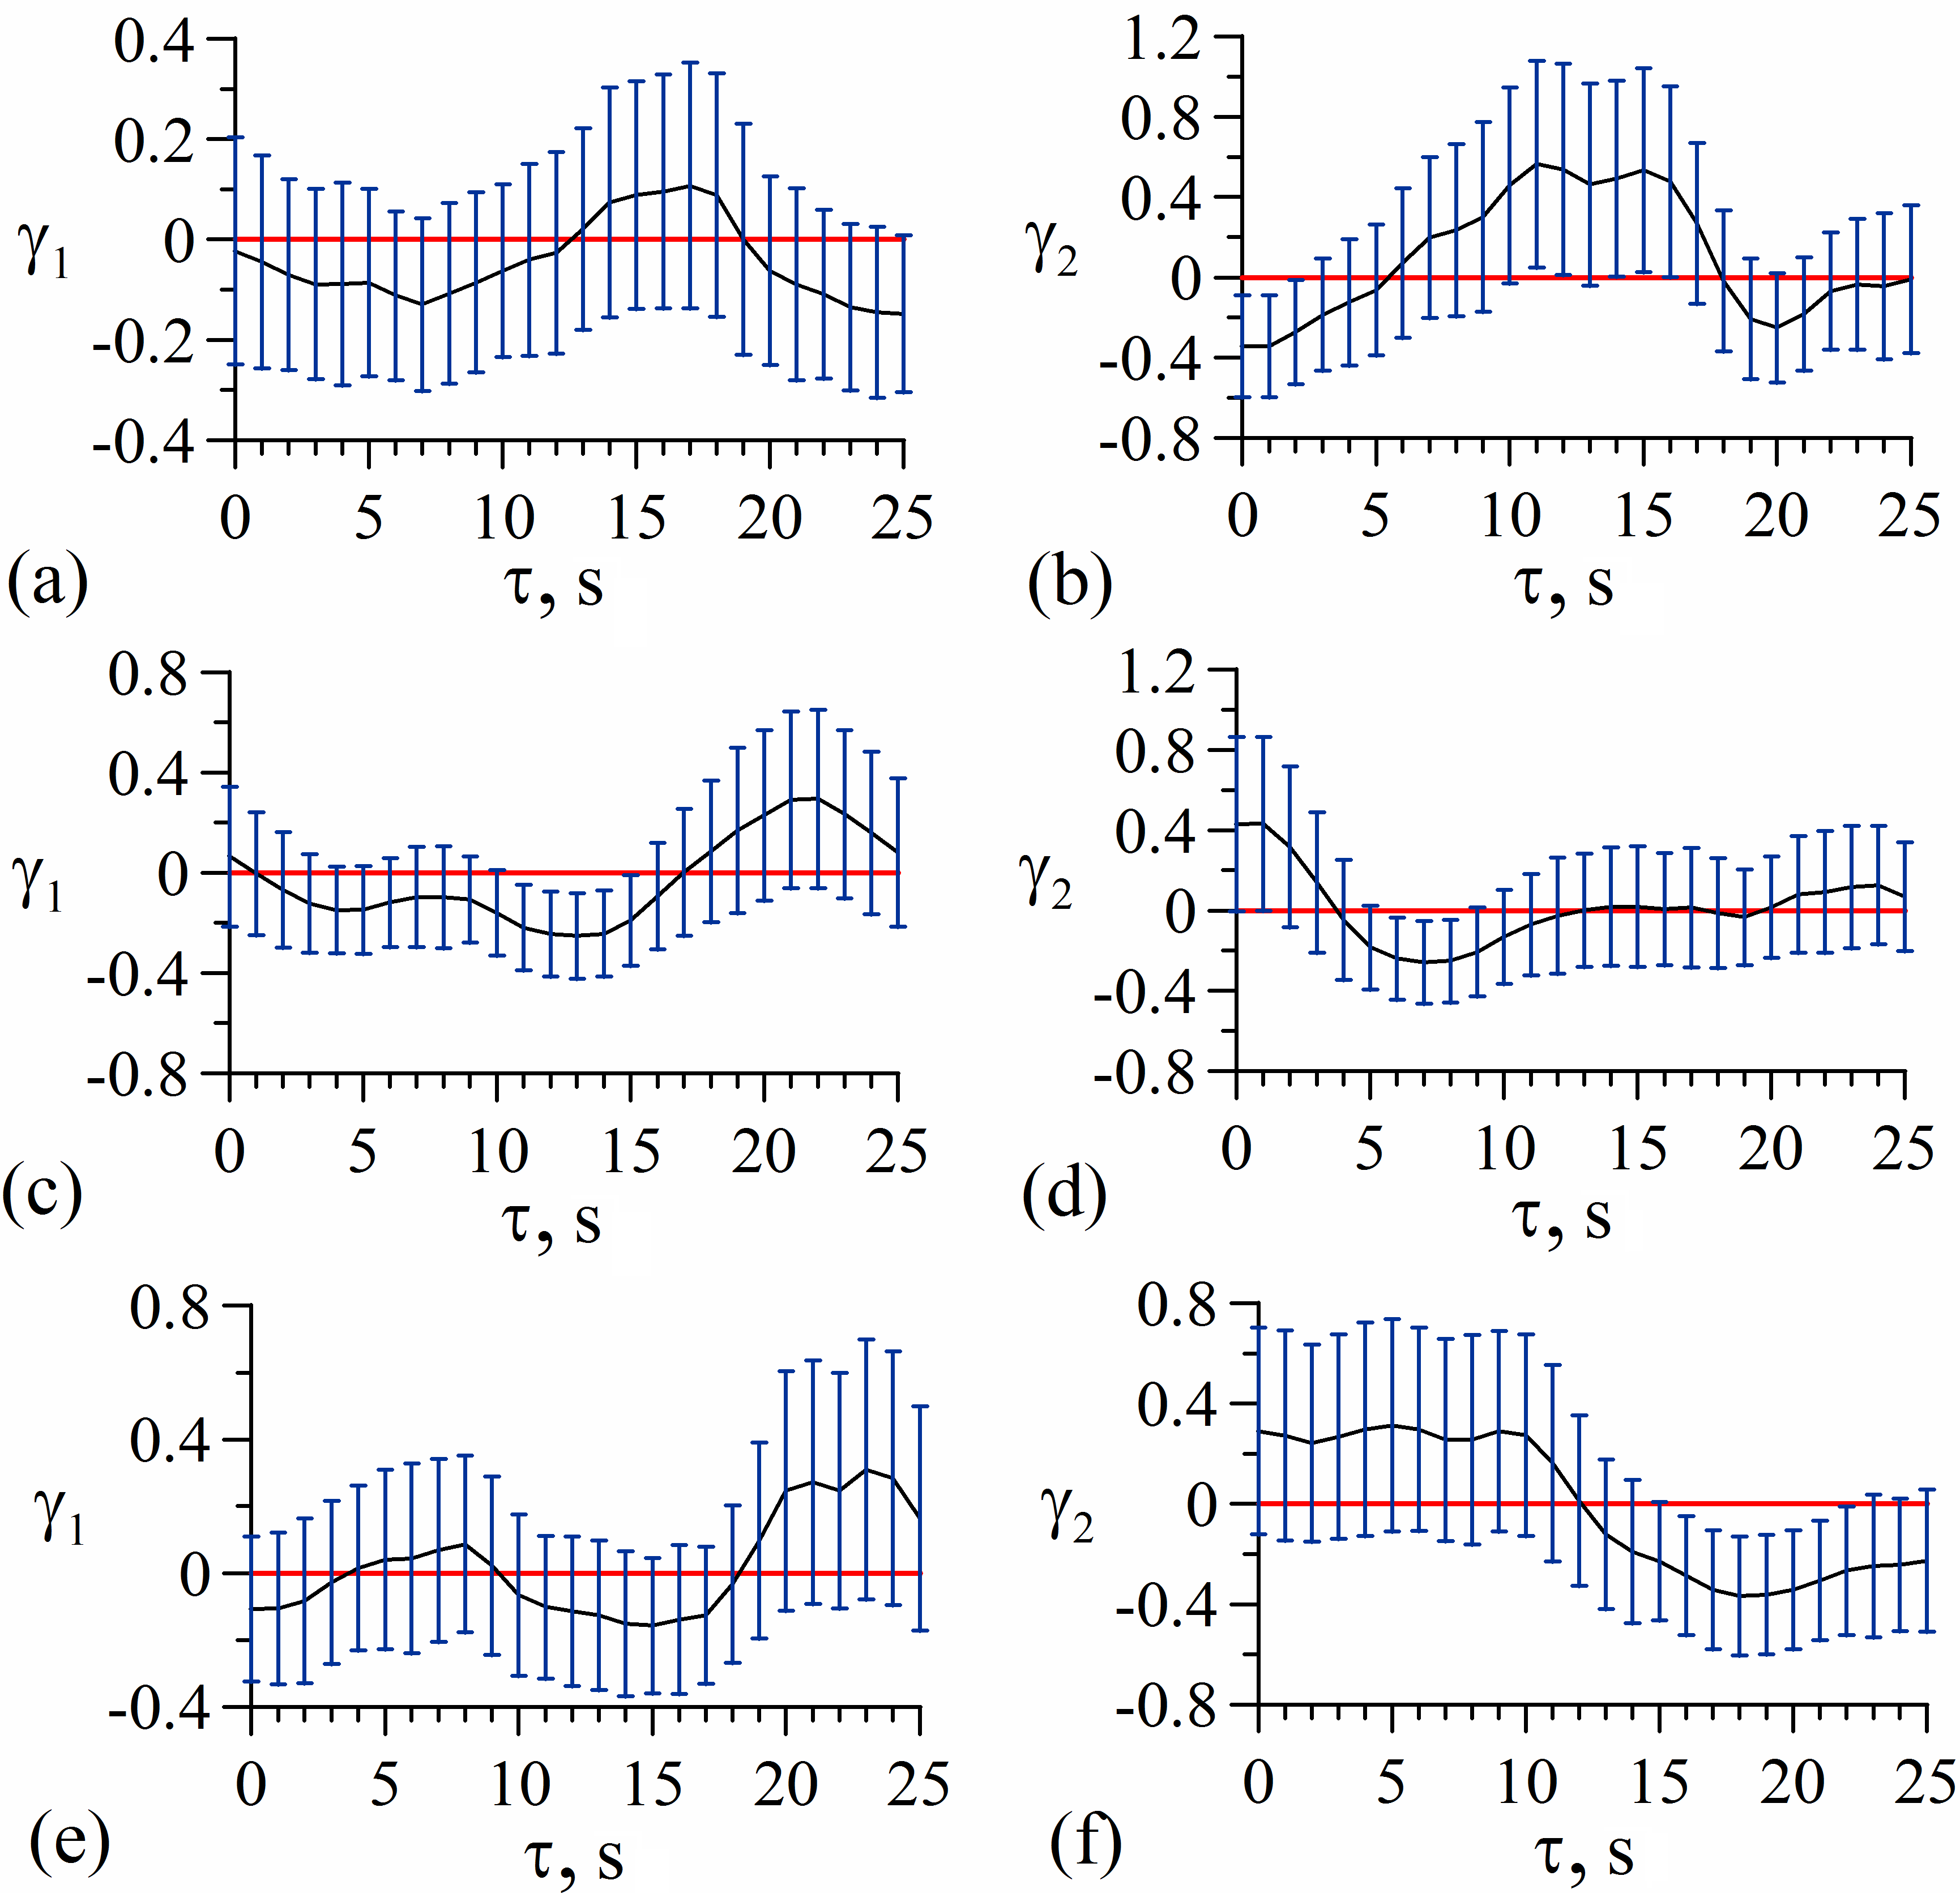
Figure 3. Dependences of coupling indices γ1,2 on delay time τ for the signals recorded during the spinal block: (а) influence of PPGear on HRV; (b) influence of HRV on PPGear; (c) influence of PPGfinger on HRV; (d) influence of HRV on PPGfinger; (e) influence of PPGtoe on HRV; (f) influence of HRV on PPGtoe. The vertical tick marks represent 95% confidence interval.
Figure 2 demonstrates that in pre surgery normal state there is significant influence from heart rate regulation on vascular tone regulation in earlobe, ring finger and second toe (Figures 2b, 2d, and 2f), since the coupling indices with 95% confidence interval are above zero. The influence in the opposite direction was not detected (i.e. the influence of PPGfinger, PPGear, and PPGtoe on HRV) for the considered patient.
Figure 3 demonstrates that during the spinal block there is no coupling between the loops of autonomic control of heart rate and vascular tone. Similar results were obtained for the signals recorded during the ataractanalgesia (general anesthesia). In this case, no coupling was also detected between the 0.1 Hz rhythms of the studied systems.
Discussion
In contrast to the previous studies [7-12] focused on the detection of influence of different anesthetic drugs on autonomic control of heart rate and arterial pressure, the present study was aimed at estimating the strength and direction of coupling between the autonomic control of heart rate and vascular tone for the patients under the spinal block and the ataractanalgesia. In [8-10] it was demonstrated that propofol suppresses the activity of sympathetic control of heart rate. Using the phase dynamics modeling approach for coupling detection, the present study demonstrated that the spinal block and ataractanalgesia induction with administration of propofol suppress the influence of loop of heart rate autonomic control on the loop of vascular tone autonomic control. The results were obtained from the analysis of coupling between the HRV and PPG signal from the several body regions (earlobe, right ring finger, and right second toe). Therefore, the study shows that method of the regional anesthesia and ataractanalgesia are both influencing central mechanisms of autonomic control through optic thalamus and suppress coupling between the heart rate control and vascular tone control.
The obtained results may have not only diagnostic, but also prognostic importance for the estimation of circulatory failure during operations under surgical anesthesia.
Conclusion
The method of coupling detection based on phase dynamics modeling was used to demonstrate that the spinal block and araktanalgeziya suppress coupling between the loops of sympathetic control of heart rate and vascular tone.
Conflict of Interest
This study was funded by the Russian Science Foundation, Grant No. 19-12-00201.
Acknowledgments
Authors dedicate the article to memory of Professor Dmitry V. Sadchikov (died in January 2019) who formulated the idea of this study and actively supported the interdisciplinary cooperation and application of advancements mathematical methods to the study of biomedical problems.
Ethical approval
All procedures performed in studies involving human participants were in accordance with the ethical standards of the institutional research committee and with the 1964 Helsinki declaration and its later amendments or comparable ethical standards.
- Anokhin PK. Fundamental questions of the general theory of functional systems. Moscow, USSR, 1971; 61 p. Russian.
- Bezruchko BP, Smirnov DA. Extracting knowledge from time series: An introduction to nonlinear empirical modeling. Berlin, Heidelberg: Springer, 2010; 407 p. https://doi.org/10.1007/978-3-642-12601-7.
- Granger CWJ. Investigating causal relations by econometric models and cross-spectral methods. Econometrica 1969; 37(3): 424-438. https://www.jstor.org/stable/1912791.
- Kreuz T, Mormann F, Andrzejak RG, Kraskov A, Lehnertz K, Grassberger P. Measuring synchronization in coupled model systems: a comparison of different approaches. Physica D: Nonlinear Phenomena 2007; 225(1): 29-42. https://doi.org/10.1016/j.physd.2006.09.039.
- Prokhorov MD, Ponomarenko VI, Gridnev VI, Bodrov MB, Bespyatov AB. Synchronization between main rhythmic processes in the human cardiovascular system. Phys Rev E Stat Nonlin Soft Matter Phys 2003; 68(4 Pt 1): 041913. https://doi.org/10.1103/PhysRevE.68.041913.
- Karavaev AS, Prokhorov MD, Ponomarenko VI, Kiselev AR, Gridnev VI, Ruban EI, et al. Synchronization of low-frequency oscillations in the human cardiovascular system. Chaos 2009; 19(3): 033112. https://doi.org/10.1063/1.3187794.
- Estafanous FG, Brum JM, Ribeiro MP, Estafanous M, Starr N, Ferrario C. Analysis of Heart Rate Variability to Assess Hemodynamic Alterations Following Induction of Anesthesia. J Cardiothorac Vasc Anesth 1992; 6(6): 651-657; https://www.ncbi.nlm.nih.gov/pubmed/1361865.
- Galletly DC, Corfiatis T, Westenberg AM, Robinson BJ. Robinson Heart rate periodicities during induction of propofol-nitrous oxide-isoflurane anaesthesia. Br J Anaesth 1992; 68(4): 360-364. https://doi.org/10.1093/bja/68.4.360.
- Robinson BJ, Buyck HC, Galletly DC. Effect of propofol on heart rate, arterial pressure and digital plethysmograph variability. Br J Anaesth 1994; 73(2): 167-173. https://doi.org/10.1093/bja/73.2.167.
- Kanaya N, Hirata N, Kurosawa S, Nakayama M, Namiki A. Differential effects of propofol and sevoflurane on heart rate variability. Anesthesiology 2003; 98(2): 34-40. https://doi.org/10.1097/00000542-200301000-00009.
- Hanss R, Bein B, Ledowski T, Lehmkuhl M, Ohnesorge H, Scherkl W, et al. Heart rate variability predicts severe hypotension after spinal anesthesia for elective cesarean delivery. Anesthesiology 2005; 102(6): 1086-1093. https://doi.org/10.1097/00000542-200506000-00005.
- Kweon TD, Kim SY, Cho SA, Kim JH, Kang YR, Shin YS. Heart rate variability as a predictor of hypotension after spinal anesthesia in hypertensive patients. Korean J Anesthesiol 2013, 65(4): 317-321. https://doi.org/10.4097/kjae.2013.65.4.317.
- Kenwright DA, Bernjak A, Draegni T, Dzeroski S, Entwistle M, Horvat M, et al. The discriminatory value of cardiorespiratory interactions in distinguishing awake from anaesthetised states: a randomized observational study. Anaesthesia 2015, 70(12), 1356-1368 https://doi.org/10.1111/anae.13208.
- Musizza B, Stefanovska A, McClintock PV, Palus M, Petrovcic J, Ribaric S, et al. Interactions between cardiac, respiratory and EEG-δ oscillations in rats during anaesthesia. J Physiol 2007; 580(Pt 1): 315-326. https://doi.org/10.1113/jphysiol.2006.126748.
- Bezruchko BP, Gridnev VI, Karavaev AS, Kiselev AR, Ponomarenko VI, Prokhorov MD, et al. Technique of investigation of synchronization between oscillatory processes with the frequency of 0.1 Hz in the human cardiovascular system. Izvestiya Vysshikh Uchebnykh Zavedeniy. Prikladnaya Nelineynaya Dinamika 2009; 17(6): 44–56. Russian. https://elibrary.ru/item.asp?id=13022211.
- Kiselev AR, Karavaev AS, Gridnev VI, Prokhorov MD, Ponomarenko VI, Borovkova EI, et al. Method of estimation of synchronization strength between low-frequency oscillations in heart rate variability and photoplethysmographic waveform variability. Russ Open Med J 2016; 5: e0101. https://doi.org/10.15275/rusomj.2016.0101.
- Otnes R, Enokson L. Applied time series analysis: Basic methods. Moscow, USSR: Mir, 1982; 428 p. Russian. https://search.rsl.ru/ru/record/01001092297.
- Box GEP, Jenkins GM, Reinsel GC. Time series analysis: Forecasting and control. New Jersey: John Wiley & Sons Inc., 2008; 784 p. https://doi.org/10.1002/9781118619193.
- Smirnov DA, Bezruchko BP. Estimation of interaction strength and direction from short and noisy time series. Phys Rev E Stat Nonlin Soft Matter Phys 2003; 68 (4 Pt 2): 046209. https://doi.org/10.1103/PhysRevE.68.046209.
- Kuramoto Y. Chemical oscillations, waves and turbulence. Berlin: Springer-Verlag, 1984; 158 p. https://doi.org/10.1007/978-3-642-69689-3.
Received 13 May 2019, Revised 13 June 2019, Accepted 18 July 2019
© 2019, Navrotskaya E.V., Alipov V.V., Ishbulatov Yu.M., Bezruchko B.P., Zeulina E.E., Kuligin A.V., Sadchikov D.V.
© 2019, Russian Open Medical Journal
Correspondence to Prof. Boris P. Bezruchko. Address: Department of Dynamic Modeling and Biomedical Engineering, Saratov State University, Astrakhanskaya str., 83, Saratov, 410012, Russia. E-mail: bezruchkobp@gmail.com.
