Introduction
Quality of life (QoL) is the integral assessment of patients’ physical, mental, and social functioning, based on their subjective perception. The study of QoL indicators and their changes in dynamics, along with the study of physical, laboratory, and instrumental data, helps to evaluate the effectiveness and feasibility of the ongoing therapy [1, 2]. According to numerous studies, it has been determined that obesity has a negative impact on the quality of life indicators; weight loss has a distinct positive effect on these parameters [3-7]. Heterogeneity of obesity has been discussed over the recent years. Metabolically healthy obesity has been singled out as a special phenotype, in which indicators of carbohydrate metabolism, lipid spectrum, and blood pressure remain intact, despite high body mass index (BMI) [8]. Up until recently, unified definitions of metabolically healthy obesity (MHO) have not been developed, which consistently affects the variability of data regarding its prevalence. After analysing 27 studies using 30 different definitions, the prevalence of this obesity phenotype ranged from 10 to 51% [9]. According to the 2013 BioSHaRE-EU Healthy Obese research project, which included 10 large-scale cohort studies using more stringent MHO criteria – none of the metabolic syndrome (MS) criteria, the MHO prevalence in women ranged from 7% to 28% and in men from 2% to 19% [10]. According to Russian researchers, MHO prevalence depending on the region of the Russian Federation ranges from 25.7% to 52.2% [11].
Currently, very few works are dedicated to QoL assessment in MHO patients. According to the results of the Korean National Health and Nutrition Examination Survey (KNHANES), which involved 6217 men and 8243 women, QoL of patients with MHO was negatively influenced less by obesity, but more by the presence of metabolic disorders [12]. At the same time, there is evidence that a high BMI is associated with a decrease in the quality of life even in the absence of metabolic disorders [13, 14].
The purpose of the study was to analyse quality of life indicators in patients with metabolically healthy obesity associated with ≥5% weight loss.
Material and Methods
Study design
The study involved 44 patients with MHO according to the IDF criteria of the metabolic syndrome (MS), 2005. Apart from the mandatory criterion, i.e. obesity (BMI≥30 kg/m2), this group included patients characterized by the presence of no more than one of the following MS components: triglycerides level (TG) ≥150 mg/dl (1.69 mmol/l) or specific lipid-lowering therapy; high density lipoprotein cholesterol level (HDL) <40 mg/dL (1.0 mmol/L) in men and <50 mg/dL (1.3 mmol/L) in women, or specific lipid-lowering therapy; systolic blood pressure (SBP) ≥130 mmHg or diastolic blood pressure (DBP) ≥85 mmHg or antihypertensive therapy; an increase in fasting plasma glucose (FPG) ≥110 mg/dl (5.6 mmol/L), or hypoglycemic therapy.
The comparison group included 33 patients with metabolically unhealthy obesity (MUHO). The age of the participants ranged from 19 to 59 years. We assessed the indicators of anthropometry, carbohydrate and lipid metabolism initially and after 6 months against the background of body weight decrease. To assess patients’ QoL, we used the non-specialized SF-36 questionnaire (Medical Outcomes Study – Short Form 36), which includes 36 questions grouped into 8 scales: physical functioning (PF), physical role functioning (PRF), bodily pain (BP), general health (GH), vitality (V), social functioning (SF), emotional role functioning (ERF), mental health (MH) [15].
Eligibility criteria
The eligibility criteria for the study were as follows: gender – female, age 19 to 59 years, presence of obesity (BMI≥30 kg/m2) in combination with one of the components of the metabolic syndrome (except for waist circumference (WC)).
The non-eligibility criteria for the study were as follows: gender – male, age younger than 19 and older than 59 years, BMI less than 30 kg/m2, presence of chronic inflammatory and infectious diseases, severe form of type 2 diabetes, type 1 diabetes, chronic infectious and inflammatory diseases in the acute stage, presence of acute cardiovascular events (myocardial infarction, stroke) in the medical history, severe somatic pathology, cancer, pregnancy, and lactation.
Study setting
The study was conducted in the Endocrinology Clinic of the University Clinical Hospital No. 2 and the Department of Endocrinology No. 1 of the Faculty of Medicine of I.M. Sechenov First Moscow State University (Moscow, Russia).
Medical intervention
To identify MHO phenotype, we took into consideration the MS definitions (IDF, 2005). In addition to the mandatory criterion – obesity (BMI ≥30 kg/m2), this group included patients characterized by presence of not more than one of the following MS components: TG≥150 mg/dl (1.69 mmol/L) or specific lipid-lowering therapy; HDL<40 mg/dL (1.0 mmol/L) in men and <50 mg/dL (1.3 mmol/L) in women, or specific lipid-lowering therapy; SBP≥130 mmHg or DBP≥85 mmHg, or antihypertensive therapy; an increase in FPG ≥110 mg/dL (5.6 mmol/L), or sugar-reducing therapy. The comparison group included patients with metabolically unhealthy obesity.
All patients were given recommendations for lifestyle modification concerning nutrition and physical activity. Patients with multiple ineffective attempts to reduce body weight using diet therapy in their medical history were additionally prescribed pharmacotherapy for obesity: sibutramine (Reduxin®) – LLC Ozone, Russian Federation, orlistat (Xenical®) - F. Hoffmann-La Roche Ltd, Switzerland.
We performed comparative analysis of the initial indicators of anthropometry, lipid, carbohydrate metabolism and major QoL parameters. These indicators were assessed in dynamics in patients who reduced body weight by ≥5%.
In the course of observation, which lasted 6 months, we assessed anthropometry data (height (initial), body weight, waist circumference (WC), hip circumference (HC), BMI), carbohydrate and lipid metabolism parameters.
All biochemical and hormonal studies were carried out in the Interclinical Biochemical Laboratory of the Centralized Laboratory and Diagnostic Service of the Laboratory Blood Transfusion Complex of I.M. Sechenov First Moscow State University (Moscow, Russia).
QoL parameters were assessed initially and after 6 months using the non-specialized SF-36 questionnaire (Medical Outcomes Study – Short Form 36). When processing the results, the obtained answers received for all points form 8 scales. In accordance with standard processing procedure, the value of each scale is expressed in standardized points and ranges from 0 to 100, where 0 is the worst and 100 is the best quality of life.
Statistical analysis
The data obtained in the study was processed using the IBM SPSS Statistics Version 22.0 for Windows statistical software package. We estimated M±SEM (mean with standard error of the mean). To determine statistical significance of mean values in subgroups, we used analysis of variance. To assess the presence and strength of relations between numerical indicators, we used Pearson correlation coefficient. To assess the dynamics of numerical indicators, the amount of change was calculated as the difference ∆ between the values during the second and first visits. To determine reliability of change, average value of Δ was compared with zero using Student's criterion. The differences were considered statistically significant at significance level of mean difference p<0.05.
To check the applicability of parametric statistics methods, we calculated the values of skewness ration and kurtosis. The value for all numerical indicators that we used turned out to be quite small, which made it possible to use the contrast of means using analysis of variance [16].
The sample size had not been pre-calculated.
Results
Initially, during the first visit, in the course of comparison of patients in the MHO and MUHO groups, we did not obtain any statistically significant differences (р>0.05) in terms of BMI, history of obesity duration, and basal insulin level (Table 1).
Table 1. General characteristic of patients with MHO and MUHO
|
Parameter |
МHО (n=44) |
МUНО (n=33) |
p |
||||
|
M |
SEM |
SD |
M |
SEM |
SD |
||
|
BMI (kg/m²) |
37.9 |
1.2 |
7.8 |
38.7 |
0.8 |
4.3 |
0.581 |
|
Obesity duration (in years) |
17.9 |
1.5 |
10.2 |
22.6 |
2.6 |
14.9 |
0.108 |
|
Age (in years) |
34.6 |
1.5 |
9.9 |
42.6 |
2.1 |
11.8 |
0.002 |
|
WC (cm) |
106.0 |
2.2 |
14.4 |
113.0 |
2.1 |
12.1 |
0.027 |
|
SBP (mmHg) |
123.1 |
1.2 |
8.2 |
130.5 |
2.5 |
14.2 |
0.005 |
|
Fasting glucose (mmol/L) |
5.0 |
0.1 |
0.5 |
5.8 |
0.2 |
1.0 |
<0.001 |
|
Total cholesterol (mmol/l) |
5.1 |
0.2 |
0.9 |
5.7 |
0.2 |
1.1 |
0.017 |
|
HDL (mmol/L) |
1.4 |
0.1 |
0.3 |
1.3 |
0.1 |
0.3 |
0.018 |
|
LDL (mmol/L) |
3.3 |
0.1 |
0.9 |
3.9 |
0.2 |
1.0 |
0.006 |
|
TG (mmol/L) |
1.2 |
0.1 |
0.5 |
1.9 |
0.2 |
0.9 |
<0.001 |
|
Basal insulin (μU/ml) |
13.6 |
1.5 |
10.1 |
17.1 |
1.9 |
11.1 |
0.148 |
|
HOMA Index |
3.0 |
0.4 |
2.4 |
4.4 |
0.6 |
3.2 |
0.031 |
|
C-peptide (pmol/L) |
1132.7 |
89.6 |
573.4 |
1503.3 |
96.4 |
545.1 |
0.007 |
p, p-level for mean difference; M, mean; SEM, standard error of the mean; SD, standard deviation.
Such indicators as age, SBP level, WC, fasting glucose, C-peptide, and triglycerides were initially statistically significantly lower in the MHO group (p<0.05) when included into the study. The level of high density lipoproteins in the MHO group was statistically significantly higher than in the MHO patients (p=0.018) (Table 1).
When assessing quality of life of patients with metabolically healthy obesity, it is necessary to consider the fact that this term refers exclusively to manifestations of cardiovascular pathology, carbohydrate and lipid metabolism disorders [17]. Quality of life depends on many associated diseases that are not considered as MHO criteria.
The comorbidity structure in patients from both groups has an almost equal frequency of allergic reactions and pathology of the gastrointestinal tract occurrence. Gynecological pathology was the most wide-spread one, i.e. it was observed in 50% of patients with MHO and in 70% of patients with MUHO, joint pathology was detected in 6.7% of patients with MUHO and was not detected in patients with MHO. Arterial hypertension in metabolically healthy patients is statistically less significant compared with metabolically unhealthy patients: 17.9% and 78.1% (p<0.001), as well as carbohydrate metabolism disorders: 5.3% and 45.2% (p<0.001) (Figure 1 and Figure 2).

Figure 1. Frequency of comorbidity occurrence in patient group with metabolically healthy obesity (MHO). The squares show actual frequency of pathology occurrence, the error bars – its 95% confidence interval (CI).
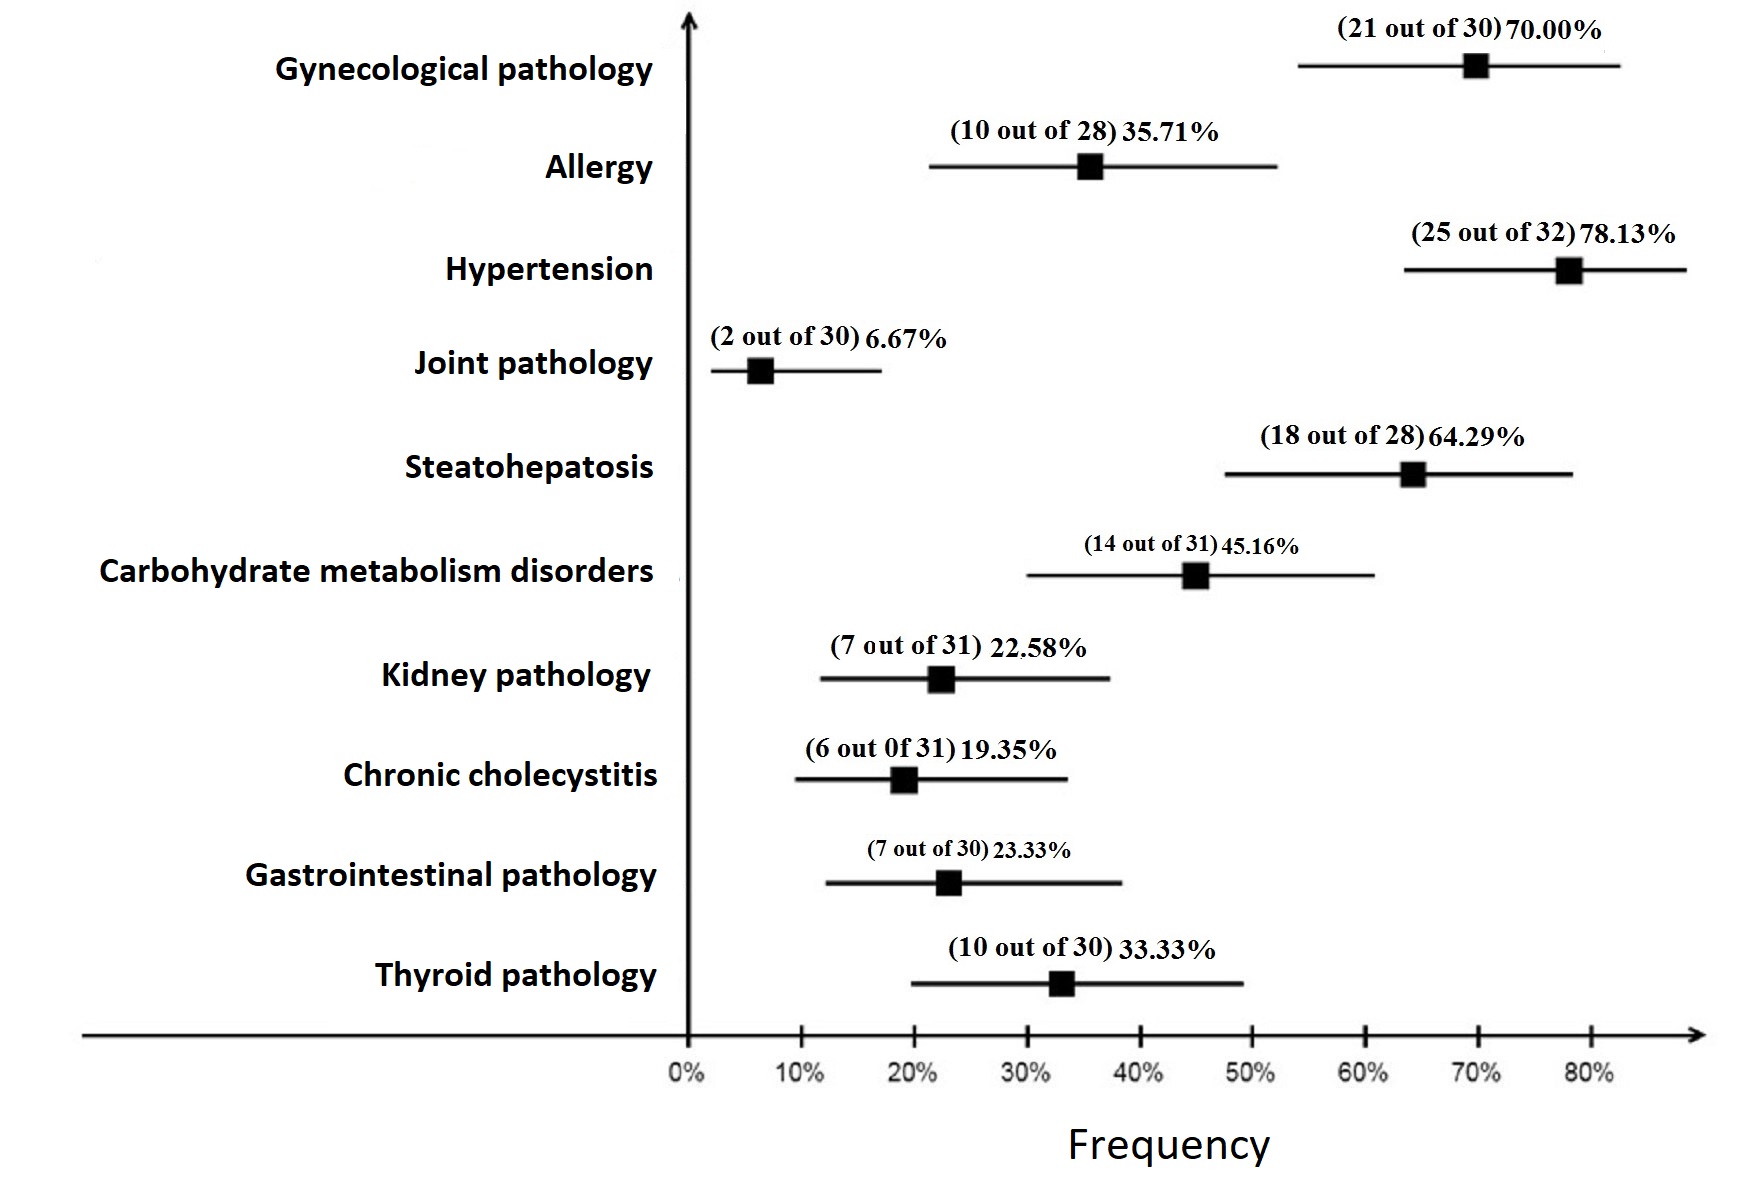
Figure 2. Frequency of comorbidity occurrence in patient group with metabolically unhealthy obesity (MUHO). The squares show actual frequency of pathology occurrence, the error bars – its 95% CI.
Initially, in the MHO group indicators of physical functioning, physical role functioning, general health, vitality and social functioning were slightly higher than in the MUHO group, while the parameters of emotional role functioning and mental health were lower than in the MUHO group, however, there were no statistically significant differences revealed – p>0.05 (Figure 3). The physical health component (PHsum), which comprises the scales of physical functioning, role functioning conditioned by physical condition, bodily pain and general health status in the MHO and MUHO groups, initially amounted to 53.9±6.7 (39.9 to 69.3) and 50.6±6.3 (36.9 to 60.3) with a statistically significant difference (p=0.032). The indicator of the mental health component (MHsum), which comprises the scales of mental health, role functioning conditioned by emotional state, social functioning, and vitality, in these groups was initially 42.1±1.8 (12.4 to 63.7) and 45.1±1.8 (15.4 to 59.5) points (p=0.255).
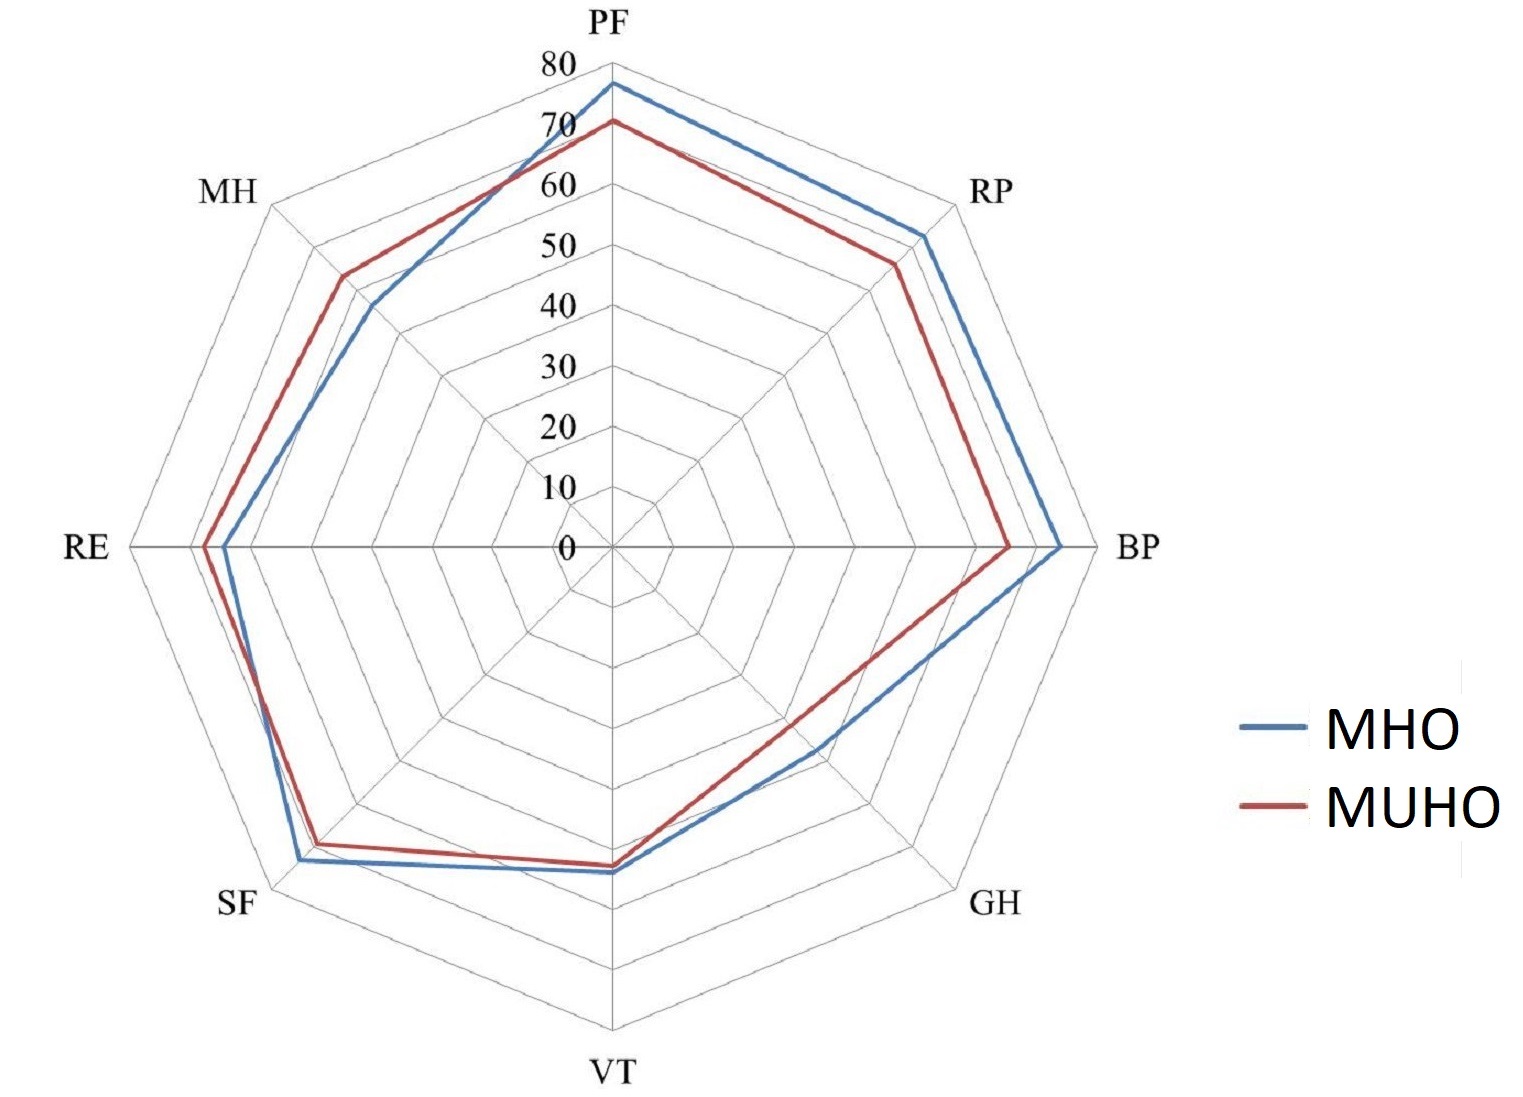
Figure 3. Initial values of QoL indicators in patients with MHO and MUHO.
MHO, metabolically healthy obesity; MUНО, metabolically unhealthy obesity; PF, physical functioning; RP, physical role functioning; BP, bodily pain; GH, general health; VT, vitality; SF, social functioning; RE, emotional role functioning; MH, mental health.
In 6 months’ time, a decrease in body weight of 5% or more was observed in 28 people in the MHO group (63.6%), and in 21 patients (63.6%) in the MUHO group. In general, all QoL indicators in both groups associated with ≥5% weight loss after 6 months increased (Table 2, Figure 4).
Table 2. Amount of change (∆) for QoL indicators in the MHO and MUHO groups in patients with ≥5% weight loss over 6 months
|
QoL indicators (∆) |
МHО |
МUНО |
p |
||
|
N |
M±SEM |
N |
M±SEM |
||
|
∆PF |
28 |
5.7±2.4 |
21 |
10.0±3.7 |
0.314 |
|
∆RP |
28 |
8.9±6.3 |
21 |
16.7±9.5 |
0.485 |
|
∆BP |
28 |
5.9±2.9 |
21 |
8.9±3.8 |
0.528 |
|
∆GH |
28 |
3.4±2.2 |
21 |
8.6±2.6 |
0.137 |
|
∆VT |
28 |
7.3±2.8 |
21 |
13.8±3.0 |
0.120 |
|
∆SF |
28 |
8.5±3.1 |
21 |
14.3±5.3 |
0.325 |
|
∆RE |
28 |
8.3±10.1 |
21 |
23.8±9.2 |
0.279 |
|
∆MH |
28 |
5.3±3.8 |
21 |
5.9±3.9 |
0.912 |
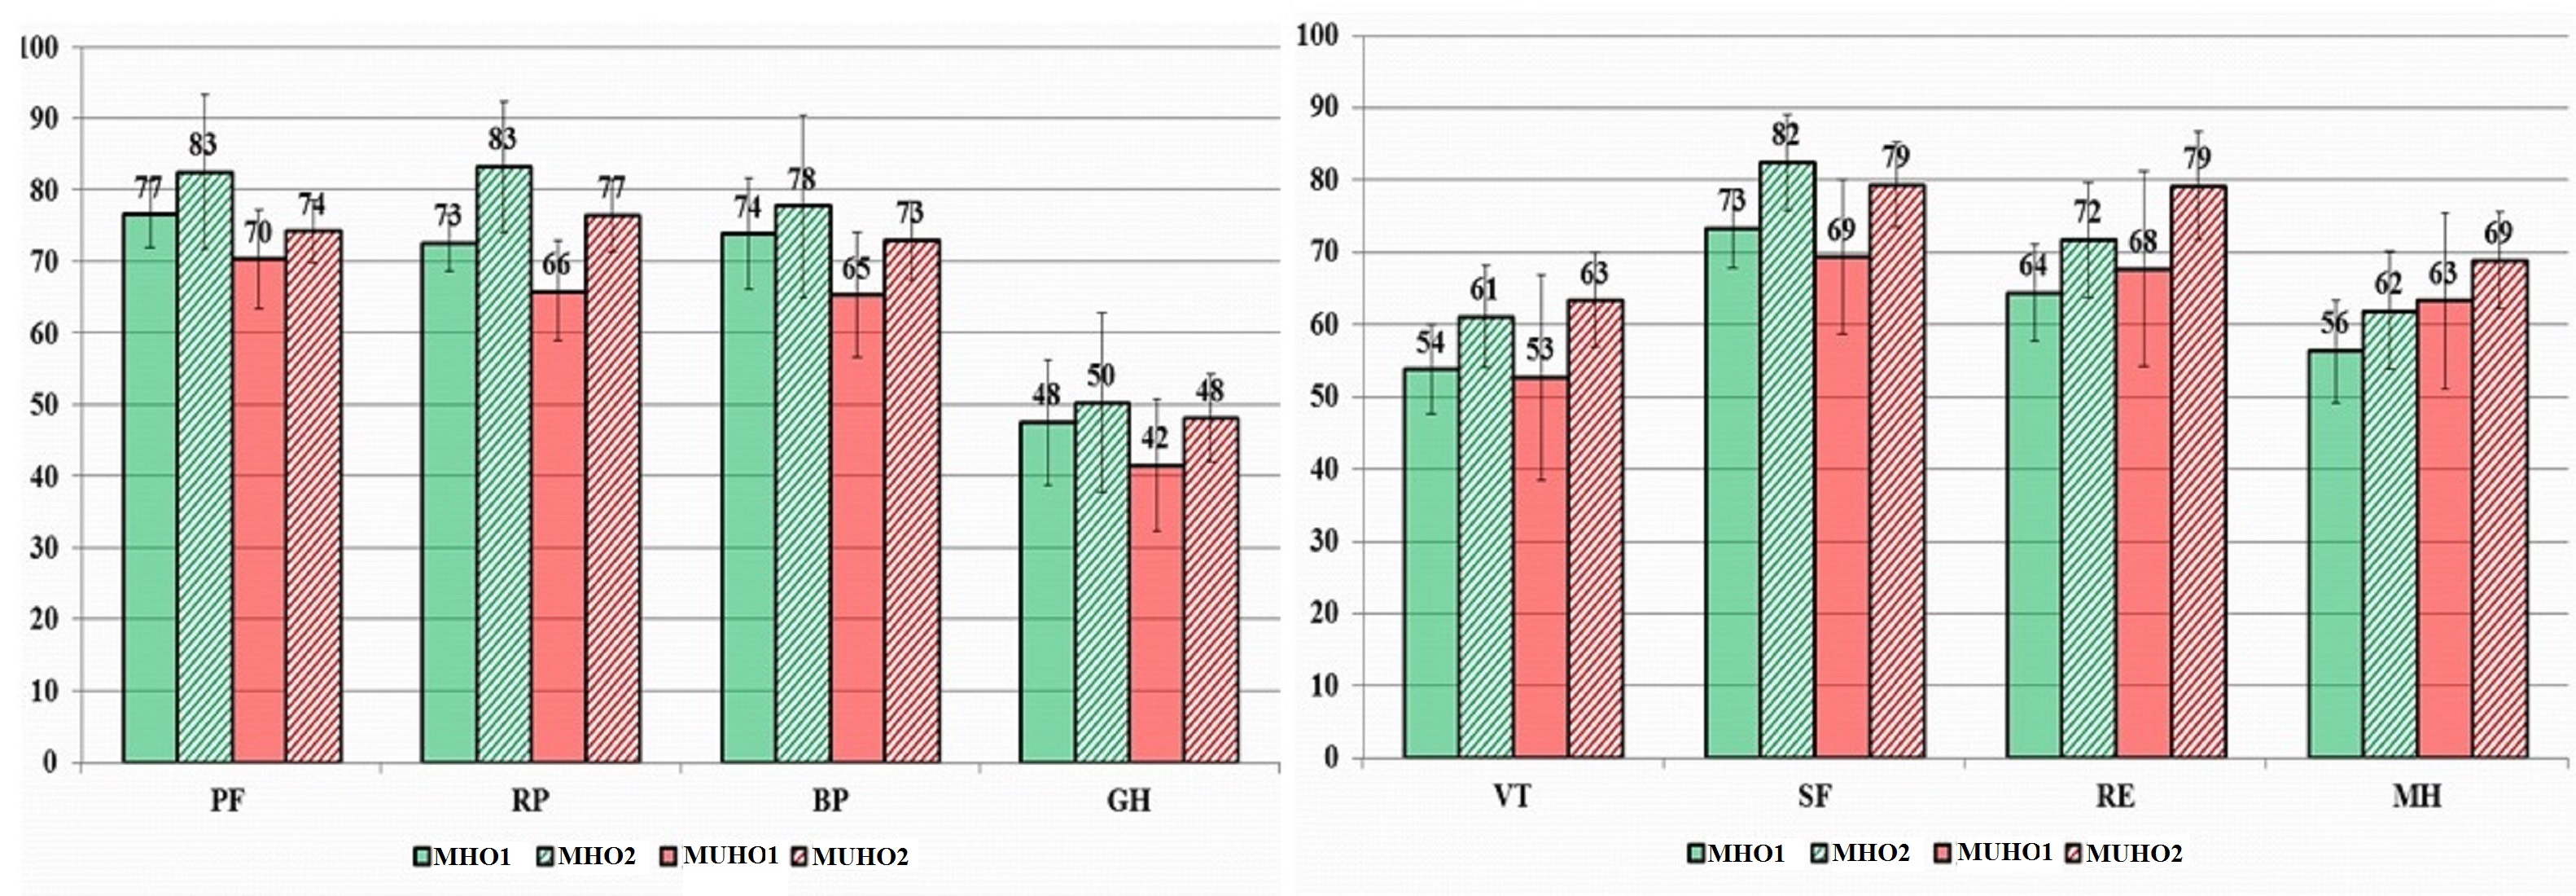
Figure 4. Dynamics of QoL indicators in patients associated with ≥5% body weight loss (in points).
MHO1, metabolically healthy obesity visit 1; МHО2, metabolically healthy obesity visit 2; МUНО1, metabolically unhealthy obesity visit 1; МUНО2, metabolically unhealthy obesity visit 2; PF, physical functioning; RP, physical role functioning; BP, bodily pain; GH, general health; VT, vitality; SF, social functioning; RE, emotional role functioning; MH, mental health.
In the MHO group indicators of physical functioning increased by 7.5%, physical role functioning – by 11.6%, vitality – by 12.8%, social functioning – by 11.2%, emotional role functioning – by 11.9%, mental health – by 8.8% from the original ones (p<0.05). In the MUHO group we observed a statistically significant (p<0.05) increase in indicators of physical role functioning – by 24.6%, role-based emotional functioning – by 39.5%, and mental health – by 9.2%, which was accompanied by a clinically significant decrease in body weight (Table 3).
Table 3. Dynamics of QoL indicators (∆) in 6 months accompanied by ≥5% body weight loss
|
QoL indicators |
MHO (n=28) |
МUНО (n=21) |
|
Physical functioning |
7.5%* |
14.6% |
|
Physical role functioning |
11.6%* |
24.6%* |
|
Bodily pain |
7.9% |
14.0% |
|
General health |
6.9% |
19.7% |
|
Vitality |
12.8%* |
27.8% |
|
Social functioning |
11.2%* |
22.6% |
|
Emotional role functioning |
11.9%* |
39.5%* |
|
Mental health |
8.8%* |
9.2%* |
* statistically significant difference (р<0.05).
We carried out analysis of the dynamics of quality of life indicators in patients whose body weight was not reduced by the time of the second visit. In the MHO group (n=2), we observed a slight decrease in the indicators of vitality, emotional role functioning, and mental health. In the MUHO group (n=6), all QoL indicators increased slightly (Figure 5).
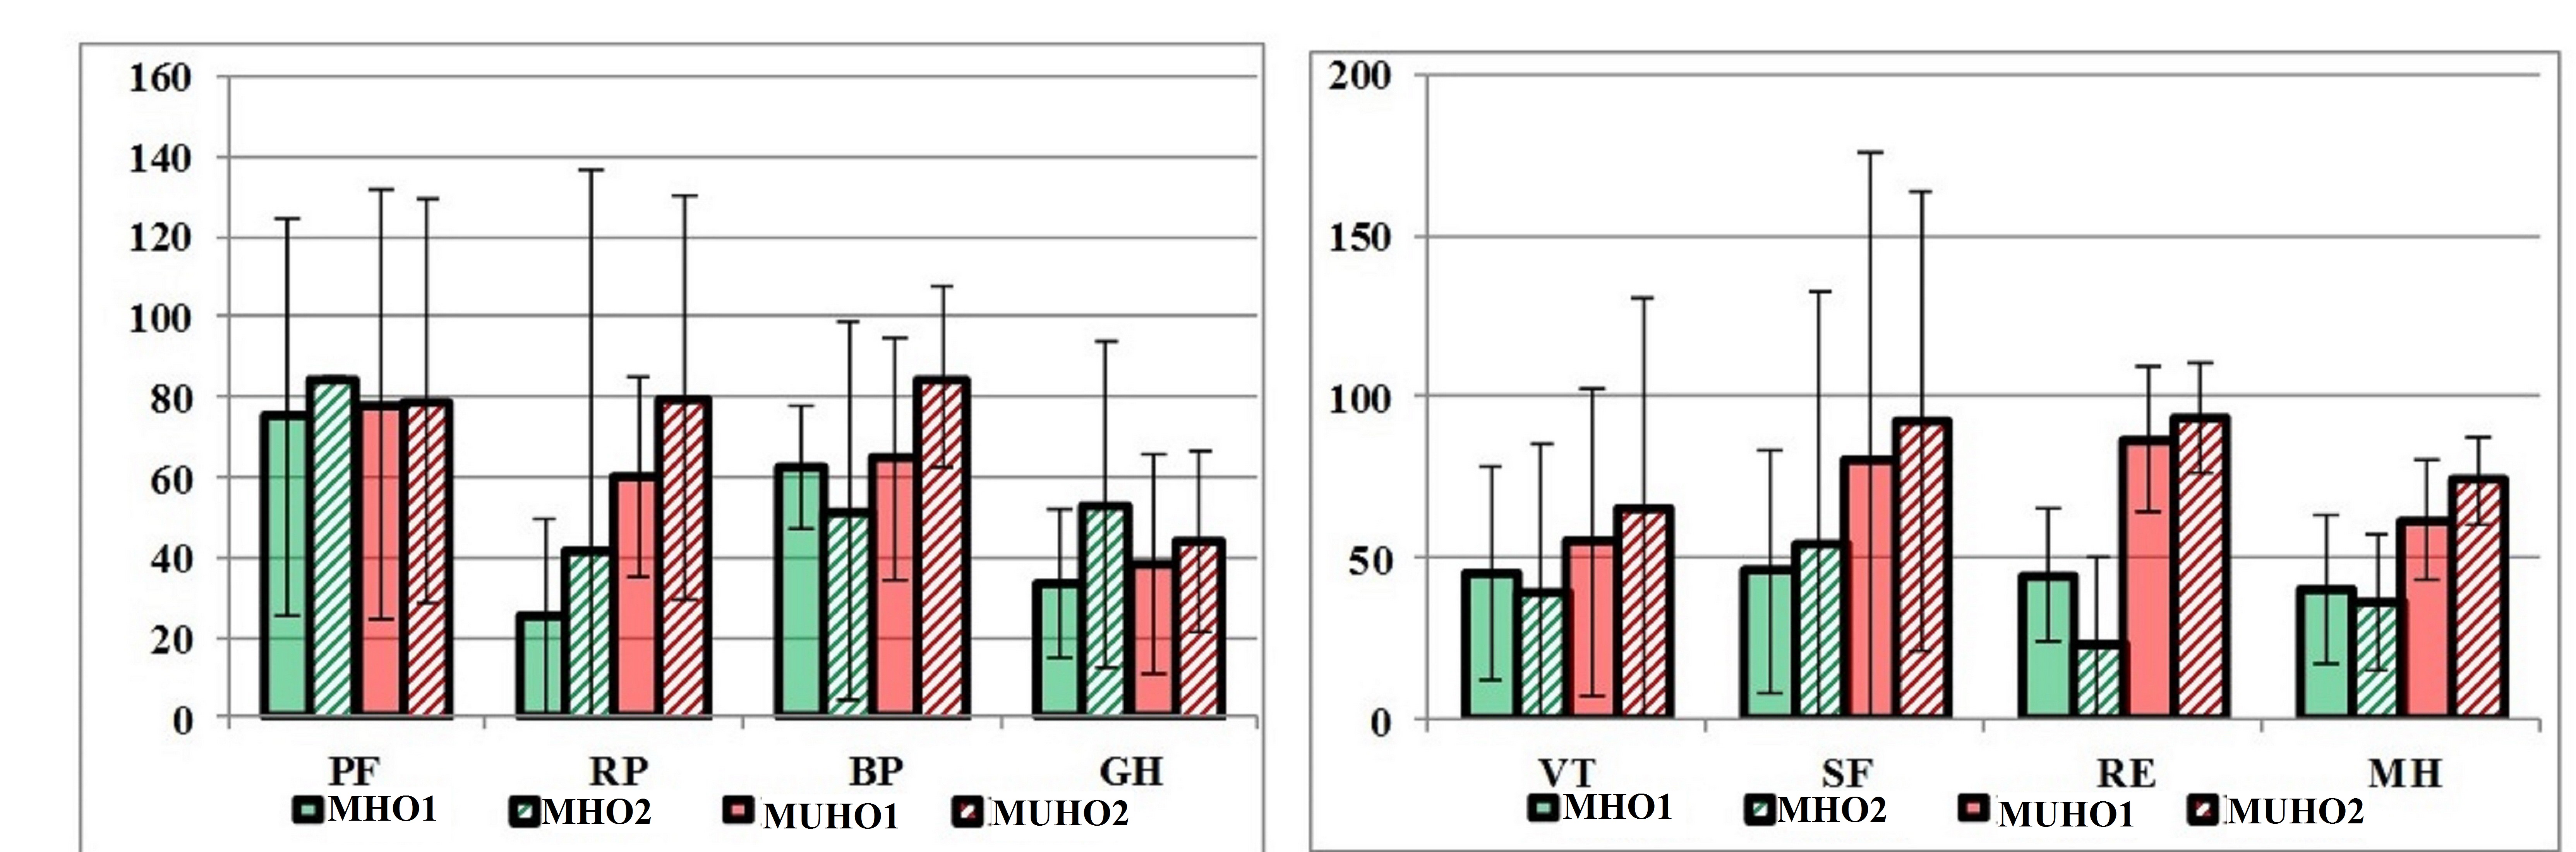
Figure 5. Dynamics of QoL indicators in patients whose body weight was not reduced (in points).
MHO1, metabolically healthy obesity visit 1; МHО2, metabolically healthy obesity visit 2; МUНО1, metabolically unhealthy obesity visit 1; МUНО2, metabolically unhealthy obesity visit 2; PF, physical functioning; RP, physical role functioning; BP, bodily pain; GH, general health; VT, vitality; SF, social functioning; RE, emotional role functioning; MH, mental health.
No undesirable effects were observed in the course of the study.
Discussion
At the point of time when our study was carried out, there had already been data available from five foreign investigations evaluating quality of life indicators in patients with metabolically healthy obesity.
In a large population-based Health Survey, which included 10,477 participants, when using the SF-12 quality of life questionnaire, patients with metabolic comorbidity demonstrated lower quality of life associated with health than those who did not have one, regardless of BMI. However, the quality of life decreases significantly in obese people with an increase in BMI even in the absence of metabolic comorbidity [14]. The statistically significantly higher frequency of arterial hypertension and carbohydrate metabolism disorders, as well as the high frequency of gynecological pathology and joint pathology in patients with MUHO, which the present study has revealed, make a certain contribution to the decrease in QoL indicators in this group of patients.
Some researchers note lower QoL indicators in patients with MHO compared with people with normal body weight, both metabolically healthy and unhealthy, especially in females [12]. Yang Y. et al. used data from the Fifth Korean National Health and Nutrition Examination Survey (KNHANES Qual Life Res 123 V-2). The researchers identified 4 groups of patients: metabolically healthy and unhealthy with normal body weight, as well as groups with metabolically healthy and unhealthy obesity (average BMI of 27.3±0.1 and 28.1±0.1 kg/m2, respectively). To assess QoL they used the EuroQol-5D questionnaire (EQ-5D). The lowest indicators of the QoL physical scale were in metabolically unhealthy males with normal body weight (BMI=22.1 kg/m2), which indicates that unhealthy metabolic status has a greater effect on the QoL than obesity. Interestingly, in females, a decrease in the quality of life was more influenced by an increase in body weight than an unhealthy metabolic status [12]. The study conducted in Germany discovered that QoL parameters conditioned by physical condition are at their highest in metabolically healthy people without excess weight, slightly lower in the MHO group, and even lower in metabolically unhealthy patients with normal body weight, and at the lowest in metabolically unhealthy people with obesity. In the MHO and MUHO groups, the overall physical health indicator for women was 49.2 (47.8 to 50.6) and 44.1 (43.1 to 45.1) points, respectively. The influence of additional factors, including age, educational status, health-related behavior, and underlying diseases on the QoL was more pronounced in women than in men [3]. In our study, the physical health component (PHsum) in the MHO and MUHO groups was initially 53.9±6.7 (39.9 to 69.3) and 50.6±6.3 (36.9 to 60.25) with a statistically significant difference (p=0.032). As for the mental health component (MHsum), initially in these groups it was 42.1±1.8 and 45.1±1.8 points (p=0.255). In a study by L.M. Donini et al., there were no statistically significant differences between the MHO and MUHO groups, both in terms of the total physical health (PHsum) 58.4±21.4 and 59.5±19.4 (p=0.33) and general mental health (MHsum) 57.8±20.1 and 61.4±17.7 (p=0.27) (an abridged version of the SF-36 questionnaire was used) [13].
In our study, we received the lowest number of points in terms of general health in both MHO and MUHO groups: 47.61±2.17 and 41.67±2.71, but without a statistically significant difference (p=0.087). This indicator was the lowest one out of eight evaluated using the SF-36 questionnaire in both groups under study. 68 women with MHO and 126 women with MUHO (taking into account the MS criteria from 2005) took part in a 2017 study conducted in Finland. Korhonen PE et.al also found the greatest decrease in terms of general health points for MHO and MUHO: 62.4±17.1 and 57.5±17.7, respectively, but with statistically significant differences between the groups (p=0.023) [7].
In our study, we have found that, despite the statistically significant differences in most metabolic indicators between the MHO and MUHO groups during the first visit, the main parameters of their quality of life did not differ significantly statistically. None of the groups showed a decrease in QoL parameters of less than 20 points on any scale, which indicates absence of a pronounced decrease in the quality of life.
The relatively low indicator of general health in the MHO group (less than 50 points) was correlated with the indicator of physical and social role functioning (more than 70 points), which indicates that in the state of general health in these patients practically does not limit their physical and social activity.
At the same time, in MHO patients whose body weight was not reduced over 6 months, there was a decrease in the parameters of vitality, emotional role functioning, and mental health.
Conclusion
According to our study, we observed higher quality of life indicator, which reflects the overall physical health component in the patient group with metabolically healthy obesity. For the general mental health component, a statistically significant difference in the indicator between the MHO and MUHO groups was not revealed. For each of the scales of the SF-36 questionnaire individually, no statistically significant difference was found between the groups of patients under study. In the MHO group, alongside with a ≥5% decrease in body weight, there was an increase in indicators of vitality, emotional role functioning and mental health alongside with an increase in social functioning. A ≥5% decrease in body weight in patients with metabolically healthy obesity and in patients with complicated obesity is accompanied by an increase in the QoL. This determines the need for weight loss, regardless of the phenotype of obesity.
Conflict of interest
Some results of this study was presented on Joint Event on 12th International Conferences on Childhood Obesity and Nutrition & 3rd World Congress on Diabetes and Obesity (March 18-19, 2019, Rome, Italy) and published as abstract in J Obes Weight Loss Ther 2019, https://www.omicsonline.org/conference-proceedings/2165-7904-C1-091-020.pdf, and on VIII All-Russian Diabetes Congress with international participation "Diabetes - a pandemic of the XXI century" (February, 2018, Moscow, Russia) and published as abstract in the collection of abstracts of the Congress https://rae-org.ru/sites/default/files/all/%D0%9C%D0%B8%D1%85%D0%B5%D0%B5%D0%BD%D0%BA%D0%BE%D0%B2%20%D0%90.%D0%90./760%208%20%D0%92%D0%94%D0%9A%20%D1%82%D0%B5%D0%B7%D0%B8%D1%81%D1%8B%20%D0%905_12%20%D0%BD%D0%B0%20%D0%BF%D0%B5%D1%87%D0%B0%D1%82%D1%8C_cropped.pdf (p. 359-360).
The authors declare no obvious or potential conflict of interest related to the publication of the present article.
Ethical approval
The clinical study within the framework of the dissertation (thesis) was approved by the Interuniversity Ethics Committee under the Association of Russian Medical Pharmaceutical Universities (Minutes No. 10 of a meeting of the Interuniversity Ethics Committee under the Association of Russian Pharmaceutical Universities from 17 Nov, 2011).
- Novik AA, Ionova TI. Guidance on the study of the quality of life in medicine. Moscow, Russia: OlmaMedia Group, 2007; 320 p. Russian.
- Testa MA. Interpretation of quality-of-life outcomes: issues that affect magnitude and meaning. Med Care 2000; 38(9 Suppl): II166-174. https://www.ncbi.nlm.nih.gov/pubmed/10982103.
- Truthmann J, Mensink GBM, Bosy-Westphal A, Hapke U, Scheidt-Nave Ch, Schienkiewitzet A. Physical health-related quality of life in relation to metabolic health and obesity among men and women in Germany. Health Qual Life Outcomes 2017; 15(1): 122. https://doi.org/10.1186/s12955-017-0688-7.
- Lopez-Garcia E, Guallar-Castillon P, Garcia-Esquinas E, Rodríguez-Artalejo F. Metabolically healthy obesity and health-related quality of life: A prospective cohort study. Clin Nutr 2016; 36(3): 853–860. https://doi.org/10.1016/j.clnu.2016.04.028.
- McDowell K, Petrie MC, Raihan NA, Logue J. Effects of intentional weight loss in patients with obesity and heart failure: a systematic review. Obes Rev 2018; 19(9): 1189-1204. https://doi.org/10.1111/obr.12707.
- Warkentin LM, Das D, Majumdar SR, Johnson JA, Padwal RS. The effect of weight loss on health-related quality of life: systematic review and meta-analysis of randomized trials. Obes Rev 2014; 15(3): 169-182. https://doi.org/10.1111/obr.12113.
- Korhonen PE., Kautiainen H. Health-related quality of life in metabolically healthy obese individuals. Obes Res Clin Pract 2017; 11(4); 499-500. https://doi.org/10.1016/j.orcp.2017.06.005.
- Karelis AD, Brochu M, Rabasa-Lhoret R. Can we identify metabolically healthy but obese individuals (MHO)? Diabetes Metab 2004; 30(6): 569-572. https://www.ncbi.nlm.nih.gov/pubmed/15671927.
- Rey-Lopez JP, de Rezende LF, Pastor-Valero M, Tess BH. The prevalence of metabolically healthy obesity: a systematic review and critical evaluation of the definitions used. Obes Rev 2014; 15(10): 781-790. https://doi.org/10.1111/obr.12198.
- Van Vliet-Ostaptchouk JV, Nuotio ML, Slagter SN, Doiron D, Fischer K, Foco L, et al. The prevalence of metabolic syndrome and metabolically healthy obesity in Europe: a collaborative analysis of ten large cohort studies. BMC Endocr Disord 2014; 14: 9. https://doi.org/10.1186/1472-6823-14-9
- Rotar O, Konradi A, Shalnova S, Balanova Y, Deev A, Oschepkova E, et al. Metabolically healthy obesity and metabolically obese normal weight in Russian population. J Hypertens 2016; 34(e-Suppl 2): e16. https://doi.org/10.1097/01.hjh.0000491368.63715.51.
- Yang Y, Herting JR, Choi J. Obesity, metabolic abnormality, and healthrelated quality of life by gender: a cross-sectional study in Korean adults. Qual Life Res 2016; 25(6): 1537–1548. https://doi.org/10.1007/s11136-015-1193-2.
- Donini LM, Merola G, Poggiogalle E, Lubrano C, Gnessi L, Mariani S, et al. Disability, physical inactivity, and impaired health-related quality of life are not different in metabolically healthy vs. unhealthy obese subjects. Nutrients 2016; 8(12); E759. https://doi.org/10.3390/nu8120759.
- Ul-Haq Z, Mackay DF, Fenwick E, Pell JP. Impact of metabolic comorbidity on the association between body mass index and health-related quality of life: a Scotland-wide cross-sectional study of 5,608 participants. BMC Public Health 2012; 12: 143. https://doi.org/10.1186/1471-2458-12-143.
- Ware JЕ, Snow КК, Kosinski М, Gandek В. SF-36 Health Survey. Manual and Interpretation Guide. 2nd ed. Lincoln, R.I.; QualityMetric; Boston, Mass.: Health Assessment Lab, 2000. https://trove.nla.gov.au/work/10434831.
- Gerasimov AN, Morozova NI. Parametric and nonparametric methods in medical statistics. Epidemiology and Vaccinal Prevention 2015; 14 (5): 6-12. https://doi.org/10.31631/2073-3046-2015-14-5-6-12. Russian.
- Romantsova TI, Ostrovskaya EV. Metabolically healthy obesity: definitions, protective factors, clinical relevance. Almanac of Clinical Medicine 2015; (S1): 75-86. https://elibrary.ru/item.asp?id=23278404. Russian.
Received 28 November 2018, Revised 20 May 2019, Accepted 11 September 2019
© 2018, Ostrovskaya Е.V., Romantsova Т.I., Gerasimov A.N., Novoselova Т.Е.
© 2018, Russian Open Medical Journal
Correspondence to Elena V. Ostrovskaya. E‐mail: e-ostrovsky@mail.ru. Phone: +79096265654.
