Introduction
Glaucoma is a multifactorial disease with neurodegenerative signs of damage to the visual analyzer, which is the cause of irreversible blindness and low vision [1]. It is estimated that more than 60 million people worldwide have glaucoma, of which 8.4 million are blind [2]. In the next 20 years, an increase in the number of patients with glaucoma is expected. Consequently, the number of blind people due to this ailment will increase. Despite the emergence of modern high-tech diagnostic methods, glaucoma is detected mainly at advanced stages of the disease [3], which reduces the effectiveness of its treatment [4].
Computerized perimetry (CP) and optical coherence tomography (OCT) are currently considered the key procedures for diagnosing glaucoma and its monitoring: they allow obtaining fairly objective information about structural and functional parameters [5, 6]. In the treatment of glaucoma, reducing intraocular pressure (IOP) [7-10] remains the only strategy with clinically proven efficacy [11].
However, even when a safe level of IOP is achieved, the death of retinal ganglion cells continues in about 20% of patients, which indicates the progression of glaucoma [12].
In such situations, use of retinoprotective therapy is justified from a medical point of view: it plays an important role in protecting the sensory part of the retina from damaging factors and, as a result, it ensures the safety of visual functions [13, 14].
Since retinoprotective treatment is long-term, most often permanent, preference in choosing medicamentous drugs is given to those that successfully combine efficacy and safety [15].
Typically, as part of a study involving long-term follow-up (lasting 3 years), all patients are regularly (every 3 months) subjected to examination of structural and functional parameters. In some cases, during long-term studies, as a result of a change in the paradigm of dynamic observation in certain diseases, the diagnostic tactics for monitoring patients may change. For example, in the Ocular Hypertension Treatment Study (OHTS), the Swedish Interactive Threshold Algorithm (SITA) protocol appeared [16,17], which made it possible to somewhat reduce study time. On some occasions, devices may also be changed. Hence, the objective of our study was to explore the possibilities of structural and functional research methods in evaluating the effectiveness of retinoprotective therapy.
Material and Methods
As part of a prospective randomized controlled trial in 2019-2020, an expansion of the study was carried out on the basis of the City Clinical Hospital No. 2 of Chelyabinsk on 17 patients (34 eyes) with a diagnosis of the primary open-angle glaucoma of advanced stage, with their IOP brought back to the norm. Patients were randomized via the envelope method into two groups. Group 1 included patients (9 women, 18 eyes) who received a course of retinoprotective therapy in the form of intramuscular injections of Retinalamin; the drug was administered once a day for 10 days 4 times a year (every 3 months). Group 2 comprised patients (6 women, two men, 16 eyes) who received the identical course of intramuscular injections of Retinalamin twice a year (every 6 months).
In addition to routine methods, all patients underwent ophthalmological examinations, including standard automated perimetry using the Octopus device (HaaG-Streit International, Koeniz, Switzerland), structural OCT using Revo NX devices (Optopol Technology SA, Zawiercie, Poland), and Spectralis OCT (Spectralis, Heidelberg Engineering, Heidelberg, Germany) (Table 1).
Table 1. Clinical and demographic characteristics of groups
|
Parameters |
Group 1 (n=9; 18 eyes) |
Group 2 (n=8: 16 eyes) |
Р3 vs. 6 mos. |
||
|
Me (Q25%; Q75%) |
Range |
Me (Q25%; Q75%) |
Me (Q25%; Q75%) |
||
|
Age (years) |
72 (68; 69) |
64-83 |
70 (69; 80) |
67-83 |
W=133.5; p=0.767 |
|
Gender (m/f) |
0/9 |
2/6 |
X2=2.976; p=0.084 |
||
|
BCVA |
1.0 (1.0; 1.0) |
1.0-1.0 |
0.8 (0.7; 1.0) |
0.5-1.0 |
W=196; p=0.041 |
|
CCT (µm) |
508 (499; 514) |
476-530 |
524 (512; 536) |
44-536 |
W=119; p=0.397 |
|
Po (mm Hg) |
13 (11.2; 15) |
9-18 |
12.5 (9.75; 16) |
6-16 |
W=159; p=0.6146 |
|
CDR |
0.645 (0.602; 0.73) |
0.3-0.89 |
0.58 (0.435; 0.69) |
0.24-0.86 |
W=183.5; p=0.1779 |
|
OD (mm2) |
1.76 (1.41; 2.08) |
1.29-3.51 |
1.98 (1.85; 2.13) |
1.6-3.4 |
W=91.5; p=0.072 |
|
RNFLo (µm) |
77.5 (66.0; 86.2) |
66-98 |
76.5 (71.8; 83.8) |
65-91 |
W=159; p=0.616 |
|
RNFLs (µm) |
67 (63; 79) |
56-92 |
71.5 (64.5; 76.2) |
52-86 |
W=139.5; p=0.89 |
Standard automated perimetry
Prior to enrollment in the study, patients were under dispensary observation, within the framework of which they were under a study using the G-dynamic program on Octopus 600. After inclusion of patients in a multicenter prospective randomized controlled study, an examination was conducted every 3 months using the 24-2 program on Octopus 900 and Octopus 600 perimeters. As criteria for evaluating the effectiveness of Retinalamin, we considered the dynamics of retinal photosensitivity.
Inclusion and exclusion criteria
Inclusion criteria: residency in the city of Chelyabinsk; an advanced stage of primary open-angle glaucoma and normal IOP values; age at the time of inclusion in the study of 45 – 89 years (middle, elderly and senile sensu the 2012 classification by the World Health Organization, www.who.int/ru); clinical refraction in the range of ±6.0 diopters and astigmatism ±1.5 diopters; regimen of topical antihypertensive therapy with medicines without contraindications for their use.
Exclusion criteria: Any other form of primary glaucoma other than the aforementioned; turbidity of optical media preventing the performance of perimetric testing; other retinal disorders (any form of age-related macular degeneration, conditions after occlusions of the retinal vessels, diabetic retinopathy and its complications) in accordance with the methodology for conducting clinical trials (https://clinicaltrials.gov); surgical ophthalmic intervention in anamnesis; injuries and diseases of the eye and its adnexa; diabetes mellitus and other common diseases requiring hormone therapy.
Verification of diagnoses
In all cases, the diagnosis was established in accordance with the system of differential diagnosis of diseases and confirmed by specific research methods in the medical records.
Statistical analysis
The obtained data were processed using the Python 3.8 Programming Language. The parameter values are presented in the format of Me (Q25%; Q75%), where Me is the median, and Q25% and Q75% are quartiles. For pairwise intergroup comparisons, the Wilcoxon t-test was used.
The Bland-Altman plot was obtained as follows: the average value for each pair was plotted on the x-axis (the measurement values were obtained via different instruments or using different programs), whereas the difference between the values within the pair was plotted on the y-axis. Further, for the resulting difference of values, the mean and standard deviation were calculated, after which three horizontal lines were drawn on the graph, indicating the mean and mean ±1.96 standard deviation of the measurement difference, which corresponded to 95% confidence interval (CI).
Results and Discussion
At the onset of the study using the G-dynamic and 24-2 programs, there were no statistically significant differences between the groups in mean deviation of retinal photosensitivity (MD) and pattern standard deviation of mean retinal photosensitivity (PSD). However, the absolute values differed both between the groups and between the programs, which was a manifestation of fluctuations in the perimetric testing data.
For instance, the medians for the MD parameter in the G-dynamic program were 3.272 (2.05; 4.05) in Group 1 and 4.866 (2.25; 8.17) in Group 2, W=-0.854; p=0.392; in 24-2 program, the medians were 3.495 (2.45; 5.025) in Group 1 and 5.249 (3.5; 7.37) in Group 2, W=-1.812; p=0.069. The parameter values obtained via two programs did not statistically significantly differ from each other: G-dynamic=4.069 (2.12; 5.52) and 24-2=4.326 (2.925; 5.175); WG vs. 1=-1.205; pG vs. 1=0.228); same was true about the groups (Group 1: WG vs. 1=1.107, p G vs. 1=0.268; Group 2: W G vs. 1=-0.664; p G vs. 1=0.506) (Table 2).
Table 2. Parameters of mean deviation (MD) of retinal photosensitivity and their statistical significance
|
Program and device |
n=17 (34 eyes) |
Group 1 (n=9; 18 eyes) |
Group 2 (n=8: 16 eyes) |
Statistical significance |
|
Me (Q25%; Q75%) |
||||
|
md_G_dynamic (600) |
4.069 (2.12; 5.52) |
3.272 (2.05; 4.05) |
4.866 (2.25; 8.17) |
W=-0.854; p-value=0.392 |
|
md_24_900_1 |
4.326 (2.925; 5.175) |
3.495 (2.45; 5.025) |
5.249 (3.5; 7.37) |
W=-1.812; p-value=0.069 |
|
md_24_900_2 |
4.673 (2.949; 6.600) |
4.135 (2.25; 6.000) |
5.272 (3.15; 7.175) |
W=-1.125; p-value=0.260 |
|
md_24_900_2 |
4.263(2.075; 6.3) |
3.594 (1.275; 6.149) |
5.1 (.875; 6.675) |
W=-1.225; p-value=0.220 |
|
md_24_600 |
3.069 (1.125; 4.2) |
2.81 (1.500; 3.675) |
3.393 (0.9; 4.275) |
W=-0.732; p-value=0.464 |
|
Statistical significance |
WG vs. 1=-1.205 pG vs. 1=0.228 W1 vs. 2=-0.711 p1 vs. 2=0.476 W3 vs. 600=1.582 p3 vs. 600=0.113 |
WG vs. 1=-0.964 pG vs. 1=0.334 W1 vs. 2=-1.068 p1 vs. 2=0.285 W3 vs. 600=0.757 p3 vs. 600=0.448 |
WG vs. 1=-0.664 pG vs. 1=0.506 W1 vs.2=0.015 p1 vs. 2=0.987 W3 vs. 600=1.413 p3 vs. 600=0.157 |
|
md_G_dynamic (600), mean deviation of retinal photosensitivity obtained via G-dynamic program on Octopus 600; md_24_900_1, mean deviation of retinal photosensitivity obtained via 24-2 program on Octopus 900 at the beginning of the study; md_24_900_2, mean deviation of retinal photosensitivity obtained via 24-2 program on Octopus 900 after 6 months from the onset of the study; md_24_900_3, mean deviation of retinal photosensitivity obtained via 24-2 program on Octopus 900 several days apart from the study conducted on Octopus 600; W, Wilcoxon T-test of intergroup differences; p-value, statistical significance of intergroup differences; WG vs. 1 and pG vs. 1, Wilcoxon intragroup T-test and statistical significance of difference between md_G_dynamic (600) and md_24_900_1; W1 vs. 2 and p1 vs. 2, Wilcoxon intragroup T-test and statistical significance of difference between md_24_900_1 and md_24_900_2; W3 vs. 600 and p3 vs. 600, Wilcoxon intragroup T-test and statistical significance of difference between md_24_900_3 and md_24_600.
The median for the PSD parameter in the G-dynamic program was 5.033 (4.0; 5.98) in Group 1 and 5.627 (4.075; 6.65) in Group 2, W=-0.901; p=0.367; in 24-2 program, the values were 4.375 (2.975; 5.225) in Group 1 and 4.961 (3.8; 6.175) in Group 2, W=-1.315; p=0.188 (Table 3).
Table 3. Parameters of pattern standard deviation (PSD) of mean retinal photosensitivity and their statistical significance
|
Program |
n=17 (34 eyes) |
Group 1 (n=9; 18 eyes) |
Group 2 (n=8: 16 eyes) |
Statistical significance |
|
Me (Q25%; Q75%) |
Me (Q25%; Q75%) |
|||
|
psd_G_dynamic (600) |
5.330 (3.975; 6.35) |
5.033 (4.0; 5.98) |
5.627 (4.075; 6.65) |
W=-0.901; p-value=0.367 |
|
psd_24_900_1 |
4.652 (3.525; 6.049) |
4.375 (2.975; 5.225) |
4.961 (3.8; 6.175) |
W=-1.315; p-value=0.188 |
|
psd_24_900_2 |
4.944 (3.525; 6.25) |
4.72 (3.325; 6.37) |
5.194 (3.650; 6.049) |
W=-0.657; p-value=0.510 |
|
psd_24_900_3 |
4.819 (3.050; 5.9) |
4.310 (2.7; 5.350) |
5.456 (4.475; 6.15) |
W=-1.941; p-value=0.052 |
|
psd_24_600 |
4.81. (2.875; 6.2) |
4.535 (2.8; 6.124) |
5.162 (3.774; 6.225) |
W=-0.827; p-value=0.407 |
|
Statistical significance |
WG vs. 1=1.441 pG vs. 1=0.149 W1 vs. 2=0.566 p1 vs. 2=0.571 W3 vs. 600=0.028 p3 vs. 600=0.977 |
WG vs. 1=1.107 pG vs. 1=0.268 W1 vs. 2=-0.432 p1 vs. 2=0.665 W3 vs. 600=-0.446 p3 vs. 600=0.655 |
WG vs. 1=0.901 pG vs. 1=0.367 W1 vs. 2=-0.189 p1 vs. 2=0.849 W3 vs. 600=0.489 p3 vs. 600=0.624 |
|
Between the two programs, the parameter values did not differ statistically significantly: G-dynamic=5.330 (3.975; 6.35) and 24-2=4.652 (3.525; 6.049); WG vs. 1=1.441; p G vs. 1=0.149); same was true about the groups (Group 1: WG vs. 1=1.107; p G vs. 1=0.268; Group 2: W G vs. 1=0.901; pG vs. 1=0.367).
On average, the difference in MD parameter values in the photosensitivity study between G-dynamic and 24-2 programs was -0.36 dB (CI 95%: -4.27; 3.54) (Figure 1).

Figure 1. Bland-Altman plot. Mean deviation (MD) of retinal photosensitivity measured with G-dynamic and 24-2 software on Octopus 900 instrument. Mean difference (mean diff) and standard deviation (1.96*SD) of MD parameter.
On average, the difference in PSD parameter values in the photosensitivity study between G-dynamic and 24-2 programs was 0.63 dB (CI 95%: 2.37; -1.11) (Figure 2).

Figure 2. Bland-Altman plot. Standard deviation of mean retinal photosensitivity measured with G-dynamic and 24-2 software on the Octopus 900 instrument. Mean difference (mean diff) and standard deviation (1.96*SD) of PSD parameter (pattern standard deviation of mean retinal photosensitivity) measured on Octopus G-dynamic and 24-2.
Thus, the studies performed via the programs 24-2 and G-dynamic yielded comparable results (no statistically significant differences). However, they could not be entirely identical due to the different spatial arrangement of points when using different programs. E.g., the 24-2 program implied the presentation of 56 points of space located at a distance of 6 angular degrees, while the G-dynamic program implied 59 points located along the retinal nerve fiber layer, i.e., located more physiologically.
After six months of observation, patients underwent two-time examination several days apart via 24-2 program on Octopus 600 and Octopus 900 perimeters. The following medians were obtained for MD: on Octopus 900, Group 1 – 3.594 (1.275; 6.149), Group 2 – 5.1 (2.875; 6.675), W=-1.225; p=0.220; on Octopus 600, Group 1 – 2.81 (1.500; 3.675), Group 2 – 3.393 (0.9; 4.275), W=-0.732; p=0.464. For PSD medians were as follows: on Octopus 900, Group 1 – 4.310 (2.7; 5.350), Group 2 – 5.456 (4.475; 6.15), W=-1.941; p=0.052; on Octopus 600, Group 1 – 4.535 (2.8; 6.124), Group 2 – 5.162 (3.774; 6.225), W=-0.827, p=0.407.
The average difference in MD parameter values in the study of photosensitivity sensu 24-2 program on Octopus 600 and Octopus 900 was 1.19 dB (CI 95%: 5.71; -3.32) (Figure 3).

Figure 3. Bland-Altman plot. Mean deviation (MD) of retinal photosensitivity measured with 24-2 program on Octopus 600 and Octopus 900 instruments. Mean difference (mean diff) and standard deviation (1.96*SD) of MD parameter.
The average difference in PSD parameter in the study of photosensitivity sensu 24-2 program on Octopus 600 and Octopus 900 was 0.01 dB (CI 95%: 2.14; -2.13) (Figure 4).
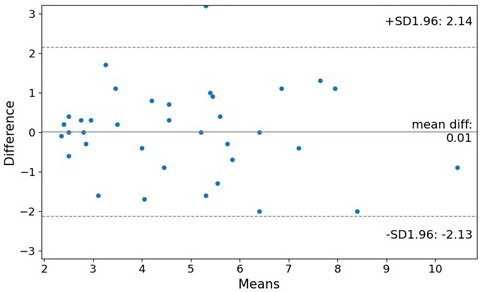
Figure 4. Bland-Altman plot. Standard deviation of mean retinal photosensitivity measured 24-2 program on Octopus 600 and Octopus 900 instruments. Mean difference (mean diff) and standard deviation (1.96*SD) of PSD parameter (pattern standard deviation of mean retinal photosensitivity) measured on Octopus 900 and 600 in 24-2 mode.
The average values of MD and PSD for retinal photosensitivity, according to our study, did not differ statistically among each other when using different models of the Octopus perimeter or when using different examination programs (G-dynamic and 24-2). Hence, both in clinical practice and in clinical research, it is possible to use any model of the Octopus device and use any threshold program.
Comparison of retinal photosensitivity in dynamics
When analyzing photosensitivity of the retina measured by Octopus 900 using the 24-2 program at the onset of the study and 6 months after, we found no statistically significant intergroup and intragroup differences.
In examining intragroup differences in MD values in Group 1, the following values were obtained: W=-1.068, p=0.285. For Group 2, the values were as follows: W=0.015; p=0.987. In the study of intergroup differences in MD at the onset of the study, W=-1.812; p=0.069; at the end of the study, W=-1.125; p=0.260. When we compared the measurements of the MD parameter at the beginning vs. the end of our study for both groups combined, our computations yielded the following values: W=-0.711; p=0.476.
In the study of intragroup differences in PSD parameter in Group 1, W=-0.432; p=0.665), and in Group 2, W=0.189; p=0.849. In the study of intergroup differences in this parameter at the onset of our research, W=-1.315; p=0.188; at the end of the study, W=-0.657; p=0.519. When comparing the measurements of MD at the beginning and at the end of the study for both groups combined, W=-0.566; p=0.571.
Thus, there were no statistically significant differences in MD and PSD between the onset and the end of our study.
According to previously published studies, the reproducibility of measurements of retinal photosensitivity via standard automated perimetry was about 2 dB, due to physiological fluctuations and replicability of the study [17, 18]. This finding suggests that the differences obtained during the study may be random, and generally fit within the limits of the earlier described retinal photosensitivity fluctuations. In long-term clinical studies, for a clearer understanding of the trend of changes, it is better to use trends that more obviously reflect the dynamics of the process [13, 19].
Study limitations
Small sample size in our study is an important factor, since in order to identify statistically significant dynamics of retinal photosensitivity according to standard automated perimetry data, changes must be above 2 dB [17, 18], thereby exceeding the physiological fluctuations in standard automated perimetry. With a follow-up period of 6 months, against the background of compensated IOP and presumed stabilization of the glaucoma process, the probability of registering such pronounced changes is very low.
As for the comparison of using two different instruments and different research programs, the sample size becomes not so critical, since all observations are compared for both groups of observations, and the resulting sample size allows using parametric methods of statistical analysis. However, perimetry data are extremely rarely evenly distributed in a sample, to say nothing of a total population. For this reason, nonparametric methods for comparing trends of the mean were chosen, which are in no way inferior in power and efficacy to parametric methods of analysis. For example, the statistical power of the study, when using a two-sided test for comparing devices and programs with a given average value of photosensitivity of 4.0 dB (in our case, 4.069±3.4 dB for the G-dynamic program), standard deviation of 3.0 dB, type I error of 5%, and the sample size of 34 observations is 82%, which is an acceptable power level for this kind of research [20].
Conclusion
As a result of conducting treatment for 6 months in both groups receiving retinoprotective therapy with Retinalamin every 3 (Group 1) or every 6 months (Group 2), the photosensitivity of the retina did not change statistically significantly. However, in both groups, we observed a positive trend in in terms of MD and PSD of the mean retinal photosensitivity, and an increase in indicator values 6 months after the onset of the study. Different instruments (Octopus 600 and Octopus 900 perimeters) and different programs (24-2 and G-dynamic) yielded different results due to their technical features and capabilities of reproducibility, but these differences were not statistically significant. Moreover, the recorded differences did not exceed the replicability index specified in the published data sources.
Ethical approval
All procedures performed in studies involving human participants were in accordance with the ethical standards of the institutional research committee and with the 1964 Helsinki declaration and its later amendments or comparable ethical standards.
Funding
No external funding was provided.
Conflict of interest
None declared.
- Casson RJ, Chidlow G, Wood JPM, Crowston JG, Goldberg I. Definition of glaucoma: Clinical and experimental concepts. Clin Exp Ophthalmol 2012; 40(4): 341-349. https://doi.org/10.1111/j.1442-9071.2012.02773.x.
- Tham YC, Li X, Wong TY, Quigley HA, Aung T, Cheng CY. Global prevalence of glaucoma and projections of glaucoma burden through 2040: A systematic review and meta-analysis. Ophthalmology 2014; 121(11): 2081-2090. https://doi.org/10.1016/j.ophtha.2014.05.013.
- Egorov EA, Erichev VP, Eds. National glaucoma guidelines for practitioners. Moscow, Russia: GEOTAR-Media. 2019; 384 p. Russian. https://doi.org/10.33029/9704-5442-8-GLA-2020-1-384.
- Andeev RV, Alexandrov AS, Bakunina NA, Basinsky AS, Blyum EA, Brezhnev AY, et al. A model of primary open-angle glaucoma: Manifestations and outcomes. Klin Med (Mosk) 2014; 92(12): 64-72. Russian. https://pubmed.ncbi.nlm.nih.gov/25980302.
- Serdyukova SA, Simakova IL. Computer perimetry in the diagnosis of primary open-angle glaucoma. Ophthalmology Journal 2018; 11(1): 54-65. Russian. https://doi.org/10.17816/OV11154-65.
- Schuman JS, Hee MR, Arya AV, Pedut-Kloizman T, Puliafito CA, Fujimoto JG, et al. Optical coherence tomography: A new tool for glaucoma diagnosis. Curr Opin Ophthalmol 1995; 6(2): 89-95. https://doi.org/10.1097/00055735-199504000-00014.
- Ekgardt VF, Dorofeev DA. Spatial contrast sensitivity in patients with primary open-angle glaucoma and ocular hypertension. Vestnik Oftalmologii 2020; 136(1): 25-35. Russian. https://doi.org/10.17116/oftalma202013601125.
- Dorofeev DA, Tur EV, Vizgalova LO, Tryapitsin ID, Ciganov AZ. The effect of preservative-free treatment of primary open-angle glaucoma on the state of ocular surface in combination therapy (intermediate results). Vestnik Oftalmologii 2019; 135(6): 52-59. Russian. https://doi.org/10.17116/oftalma201913506152.
- Dorofeev DA, Kryzhanovskaya AV, Ciganov AZ. Effectiveness of antihypertensive preservative-free therapy with fixed combination of bimatoprost and timolol (intermediate results). Vestnik Oftalmologii 2020; 136(2): 73-80. Russian. https://doi.org/10.17116/oftalma202013602173
- Antonov AA, Karlova EV, Brezhnev AYu, Dorofeev DA. Current state of ophthalmic tonometry. Vestnik Oftalmologii 2020; 136(6): 100-107. Russian. https://doi.org/10.17116/oftalma2020136061100.
- Gupta N, Aung T, Congdon N, Dada T, Lerner F, Olawoye S, et al. ICO Guidelines for Glaucoma Eye Care. San Francisco, United States: International Council of Ophthalmology. 2015; 20 p. http://www.glaucomaclinic.com/wp-content/uploads/2016/12/ICOGlaucomaGuidelines.pdf.
- Bucolo C, Platania CBM, Drago F, Bonfiglio V, Reibaldi M, Avitabile T, et al. Novel Therapeutics in Glaucoma Management. Curr Neuropharmacol 2018; 16(7): 978-992. https://doi.org/10.2174/1570159x15666170915142727.
- Strakhov VV, Egorov EA, Erichev VP, Yartsev AV, Petrov SYu, Dorofeev DA. he influence of long-term retinal protective therapy on glaucoma progression according to structural and functional tests. Vestnik Oftalmologii 2020; 136(5): 58-66. Russian. https://doi.org/10.17116/oftalma202013605158.
- Bartollino S, Chiosi F, Di Staso S, Uva M, Pascotto A, Rinaldi M, et al. The retinoprotective role of phenytoin. Drug Des Devel Ther 2018; 12: 3485-3489. https://doi.org/10.2147/DDDT.S169621.
- Kulakova YeV, Baimukhanova YeB, Portnova MG, Neizer YV. Use Use of preparation retinalamin in treatment of patients with open-angle glaucoma. Medicine and Ecology 2013; (1): 22-23. Russian.
- Heijl A, Patella VM, Chong LX, Iwase A, Leung CK, Tuulonen A, et al. A new SITA perimetric threshold testing algorithm: Construction and a multicenter clinical study. Am J Ophthalmol 2019; 198: 154-165. https://doi.org/10.1016/j.ajo.2018.10.010.
- Bengtsson B, Heijl A. Evaluation of a new perimetric threshold strategy, SITA, in patients with manifest and suspect glaucoma. Acta Ophthalmol Scand 1998; 76(3): 268-272. https://pubmed.ncbi.nlm.nih.gov/9686835.
- Bengtsson B, Heijl A. SITA Fast, a new rapid perimetric threshold test. Description of methods and evaluation in patients with manifest and suspect glaucoma. Acta Ophthalmol Scand 1998; 76(4): 431-437. https://doi.org/10.1034/j.1600-0420.1998.760408.x.
- Dorofeev DA, Kirilik EV, Klimova AV, Solovieva OB. Effect of retinal protective therapy on optical coherence tomography angiography (pilot study). Vestnik Oftalmologii 2021; 137(1): 60-67. Russian. https://doi.org/10.17116/oftalma202113701160.
- Inference for Means: Comparing Two Independent Samples. Power/Sample Size Calculator. https://www.stat.ubc.ca/~rollin/stats/ssize/n2.html.
Received 24 September 2021, Accepted 27 October 2021
© 2021, Russian Open Medical Journal
Correspondence to Dmitry A. Dorofeev. Address: 200 Rossiyskaya St., Chelyabinsk 454090, Russia. Phone: +7 9124778927. E-mail: dimmm.83@gmail.com.