Introduction
Fight against tuberculosis (TB) or TB control is still among the world’s major objectives, and, as such, is driving the main focus areas of global public health [1]. The action planning by health services is based on clear understanding of the TB prevalence. Accumulation and analysis of key epidemiologic indicators describing the scale and size of the problem of TB serves as yet another mechanism, using which the spread of TB can be further contained within a region, a country, or the world [2].
Among European countries, Russia ranked sixth for TB notification rates in 2013, next to Republic of Moldova (129), Kyrgyzstan (128), Kazakhstan (115), Ukraine (81), and Georgia (79 per 100,000 population). Interestingly, in the same 2013, concordance between new TB case detection rates and the proportions of notified new and relapse cases was relatively low in all countries (64%), compared to Russia (85%) [3]. According to World Health Organization (WHO), in 2015, the lowest notification rates for TB were reported from the counties of European (3.1%), and American (2.6%) regions [4].
Starting in 2009, TB incidence in Russia has been observed to decline steadily, 59.5/100,000 in 2014 versus 82.6/100,000 in 2009. These improvements in epidemiologic indicators for TB and indicators characterizing the level of medical care for TB count as indirect evidence of the stabilizing trends in domestic social processes and in population quality of life, as far as TB is seen not only as a derivative of the quality of life (QOL), but also, a marker of the condition of society [5].
During recent years, positive trends in TB epidemiology have started to be observed in the regions of the Far East Federal District (FEFD), as well. According to data reported by the Novosibirsk TB Research Institute, TB incidence in FEFD has declined by 36.1% for the last 10 years (2007-2016), but is still 1.8 times higher than the average national incidence. A decrease was observed in the following indicators in FEFD: proportion of new cases of fibrocavitary TB (from 4.4% to 1.4%); proportion of posthumously diagnosed cases (from 1.5% to 1.4%); mortality among new cases (from 4.6% to 2.2%). Mortality has decreased by 41.6% [6].
The most urgent problems existing today in the regions of FEFD referred to the Extreme North area are: TB caused by multidrug-resistant M.tuberculosis (MTB); high TB incidence in children from hard-to-reach populations (migrants, formerly imprisoned individuals, native population leading nomadic life) [7]. Observations have been made by researchers, that social, climatic, and ecological factors contribute to unfavorable situation with TB in FEFD [8].
Incidence in pediatric population is considered an important predictor, highly responsive to ongoing changes in epidemiologic situation [5, 9, 10]. According to data from WHO (2015), nearly 6% of all new cases of TB in the world occur in children aged 0 to 15, more than 550,000 pediatric cases of TB are registered annually, and almost 80,000 children die of TB annually. It was observed, that 72% of notified cases of TB occurred in countries of Southeast Asia or WHO African Region [4]. In Russia, the proportion of pediatric cases among total TB incidence was 3.1% in 2013 (3.8% in 1999). The worst situation with pediatric TB had been observed during the years 1992 to 2001, when the incidence of TB in children had increased almost twice (from 9.4 in 1992 to 19.1 in 2001, per 100,000 children). In 2014, the incidence of pediatric TB in Russia was 13.2 per 100,000 [9]. FEFD was observed to have the most unfavorable situation, with the incidence of 25 per 100,000 [6].
To summarize, despite the general improvement in epidemiologic situation with TB over RF, the problem of TB remains acute in FEFD. Incidence and mortality rates in FEFD, both in adult, and pediatric population exceed the average national rates. This suggests that the existing organization of work on prevention and early detection of TB in children is not allowing sufficient reduction in disease incidence. In view of the above said, there is growing need to estimate trends in TB epidemics by regions within FEFD, and to provide scientific rationale to back up the interventions aimed at improving the organization of work on TB control, which should take into consideration the regional specifics, and this was what determined the importance of this study.
This study aimed to analyze trends in TB epidemics in the Sakha Republic (Yakutia), with the purpose of developing scientifically-grounded program for organizing anti-tuberculosis measures among pediatric population of the Extreme North.
Material and Methods
Design
This study was performed as part of larger multi-center research approved by the Academy of Sciences of the Sakha Republic (Yakutia): “Multivariable research on the health status of the aboriginal and non-aboriginal population of the Sakha Republic (Yakutia), to optimize regional programs aimed at raising the quality of life of the residents of Yakutia, factoring in the distinct geographic and ethnic characteristics, and set in the context of modern-day socio-economic advancement” (Government contract no. 6512, issued September 6, 2017).
The study took place in the Sakha Republic (Yakutia), the largest subject of the Russian Federation, lying in north-east of Eurasian continent. Yakutia has an area of 3.1 mln km2, more than 40% of its territory lies above the Arctic Circle, and it covers three time zones. Up to now, Yakutia is one of the world’s most isolated and hard-to-access regions in terms of transport, as year-round transport service is lacking in 50% of its area. The territory of Yakutia is basically solid ancient 300-400-meter-thick permafrost. Natural environment and climate conditions in Yakutia are defined as extreme conditions, with long winters and short summer seasons. The territory of Yakutia covers four various types of geographic zones: taiga forest, tundra, tundra forest, and Arctic wilderness. According to 2010 Russian population census, total population of Yakutia was 9585 thousand people. Proportions of urban and rural population were, respectively 64.1% and 35.9%. Yakutia is a home to more than 120 ethnicities; largest of them are Yakuts (49.9%) and Russians (37.8%) [11].
Data source
We analyzed federal surveillance statistical reporting form no.33 (“Information on patients with tuberculosis”), and form no.8 (“Information on incident population with active tuberculosis”) for the Sakha Republic (Yakutia), and statistical compendiums for the years 1997 to 2016, a 20-year period (“Basic indicators of the anti-tuberculosis activities in the Sakha Republic (Yakutia)”).
The indicators for pediatric tuberculosis in Russia and Far East Federal District were obtained from official web-site of the Federal Research Institute for Health Organization and Informatics of Ministry of Health of the Russian Federation (http://mednet.ru).
Analysis of epidemiological data
Rates of TB incidence, prevalence, and mortality in the population of the Sakha Republic (Yakutia) were calculated as per 100,000 population.
For the purposes of a more detailed analysis of the epidemiological indicators (incidence, prevalence, primary TB infection prevalence) in the pediatric population of the Sakha Republic (Yakutia), a long 20-year period was divided to two shorter periods: Period I (1997–2006) and Period II (2007–2016).
Pediatric TB incidence in the Sakha Republic (Yakutia) was analyzed comparatively, between the incidence in Russia and FEFD, and against the total TB incidence in Yakutia.
Statistical analysis
Statistical data were processed using conventional application software packages for PC use. Student’s t-test was employed to determine the significance of differences between data sets compared. The critical significance level for the null hypothesis (absence of meaningful differences or factor influences) was 0.05. Statistical indicator was regarded as significant at p<0.05. The software used for statistical analysis of data was IBM SPSS STATISTICS 22.
Pearson’s chi-squared test (fourfold table) was used to compare groups for qualitative variables. The strength and direction of the relationship between quantitative variables were analyzed using Spearman rank correlation analysis.
Results
Key epidemiologic indicators for TB in the Sakha Republic (Yakutia) were found to have undergone substantial changes over the period from 1997 to 2016 (Figure 1).

Figure 1. Epidemiologic indicators for TB in the Sakha Republic; years 1997 to 2016 (per 100,000 pop.)
TB incidence in the population of the Sakha Republic (Yakutia) showed distinct increasing trend during the years 1997 to 2001. The incidence peak was at its highest in 2004 (84.2 per 100,000 pop.). Stabilization of TB incidence in Yakutia can be seen starting from 2015, and distinct declining trend started in 2012 (69.8 per 100,000 pop.) and lasted until 2016. Based on government statistical reports, the incidence of TB in 2016 reached its minimum over the last 20 years (54.8 per 100,000 pop.).
TB prevalence among the population of Sakha Republic had been showing distinct increasing trend during the period from 1997 to 2001 (253.1 and 281.9 per 100,000, respectively), and was observed to decline for the first time in 2002 (256.7 per 100,000). From 2003 up until 2016, TB prevalence in the republic had been declining stably, based on observations. During this period, prevalence of TB decreased by 40.5% (244.1 in 2003; 145.8 in 2016, per 100,000 pop.), reaching its minimum in 2016, over the entire period from 1997. Factors preconditioning the notable decline in TB prevalence were the adoption of new surveillance scheme for TB patients in 2003, and besides that, the decreased number of new TB patients, as well.
Our study showed the presence of statistically significant correlation between the rates of pediatric incidence and prevalence of TB in general population over the period from 1997 to 2016 (r=0.847, p=0.001).
A more thorough analysis of long-term trends in mortality from TB in the Sakha Republic (Yakutia) was performed, as far as this indicator is one of the most indicative ones (Figure 2).

Figure 2. Trends in mortality from TB in the Sakha Republic; years 1997 to 2016 (per 100,000 pop.)
In 1997, mortality from TB in Sakha Republic was established to be 9.1/100,000. The highest mortality was observed in 2008 (10.9/100,000) and the lowest – in 2016 (4.9/100,000). Overall, from 1997 to 2016, the mortality from TB had declined by 46.2%.
To highlight trends in TB mortality in Yakutia, comparative analysis was performed between two periods (period I, from 1997 to 2006, and period II, from 2007 to 2016) (Table 1). During period I (1997-2006), the mean TB mortality in the republic was 9.2/100,000, and mean decline rate was 2.4%. Period II (2007-2016) had a mean mortality of 7.6/100,000, and much more pronounced mean decline rate (-5.6%).
Table 1. TB mortality trends in the Sakha Republic (Yakutia); Years 1990 to 2016 (per 100,000 pop.)
|
Period I |
Period II |
||
|
Year |
Mortality |
Year |
Mortality |
|
1997 |
9.1 |
2007 |
8.2 |
|
1998 |
9.0 |
2008 |
10.9 |
|
1999 |
9.8 |
2009 |
10.7 |
|
2000 |
9.7 |
2010 |
5.8 |
|
2001 |
8.4 |
2011 |
8.9 |
|
2002 |
9.5 |
2012 |
8.3 |
|
2003 |
9.9 |
2013 |
6.7 |
|
2004 |
7.8 |
2014 |
5.3 |
|
2005 |
10.1 |
2015 |
5.0 |
|
2006 |
7.3 |
2016 |
4.9 |
|
Mean trend indicators:* |
|||
|
Mean level over time series |
9.2 |
7.6 |
|
|
Mean absolute rise/decline |
-0.2 |
-0.4 |
|
|
Mean rise rate/decline rate, % |
-2.4 |
-5.6 |
|
* Least squares method was used for alignment of time series.
Correlation analysis between total TB mortality and pediatric TB incidence in Yakutia over the period from 1997 to 2016 showed statistically significant correlation between the two indicators (r=0.514, p=0.020).
Results of comparative analysis of pediatric TB incidence between Sakha Republic, FEFD, and Russian Federation, are presented in Figure 3.
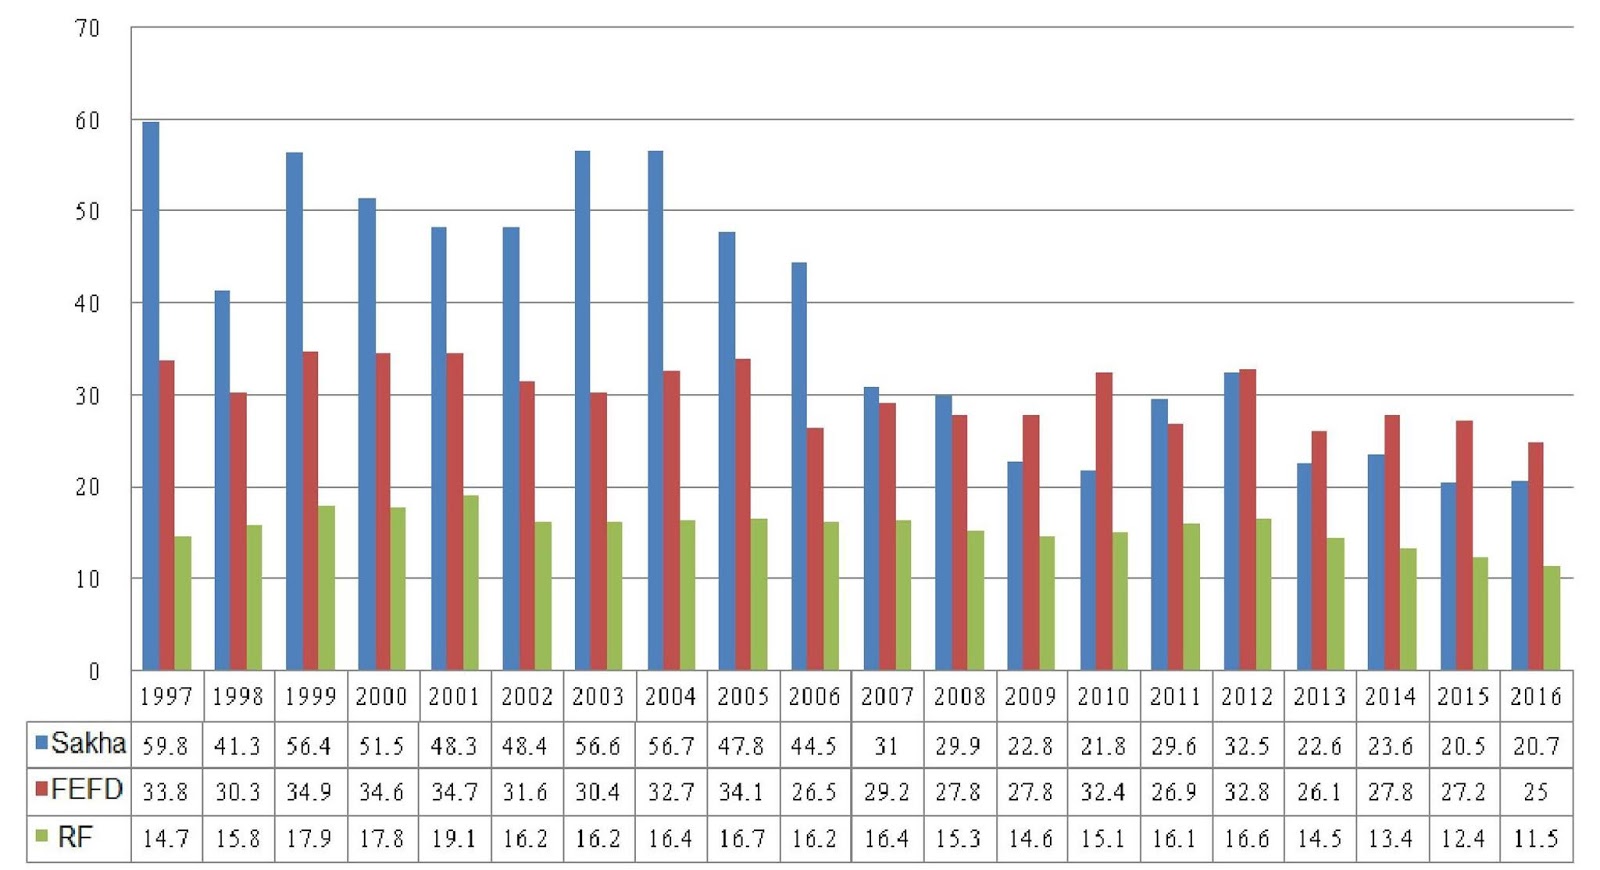
Figure 3. TB incidence between Sakha Republic, Far East Federal District, and Russian Federation; years 1997 to 2016 (per 100,000 pop.)
In 1997, pediatric TB incidence in Yakutia was 75.4% higher than that over Russia, and 43.5% higher than that in FEFD.
TB incidence level in children started to decline gradually in 2005, with the lowest observed level in 2015 (20.5/100,000). Starting in 2009 and until 2016, TB incidence in Yakutia had been lower than that over FEFD.
As is commonly accepted, adequacy of organization of preventive measures can be told from the presence of well-defined correlation between pediatric TB incidence and total TB incidence. Hence, the respectful indicators have been analyzed comparatively over the period from 1997 to 2016 (Figure 4).

Figure 4. Total TB incidence and pediatric TB incidence in the Sakha Republic; years 1997 to 2016 (per 100,000 respective population)
Pediatric TB incidence in Yakutia was found to be almost equal to total TB incidence in 1997 (59.8 and 60.8 per 100,000, respectfully), which was the peak over 20-year period. The lowest values of the same indicators were reached in 2016 (20.7 and 54.8 per 100,000 respectful population).
Using Spearman rank correlation analysis, a positive correlation was established between pediatric TB incidence and total TB incidence (r=0.476, p=0.034).
TB incidence was analyzed between two time periods (Table 2).
Time series analysis for the period I showed that mean incidence of pediatric TB was 51/100,000. In 1997, the incidence started to decline, decreasing from 59.8 to 44.5 per 100,000, with a mean decline rate of 3.2%.
In period II, mean TB incidence in children was 25.5/100,000, which was 50% lower, compared to period I. Mean decline rate during period II was 4.4%, which was higher, compared to period I.
It should be specified, that the proportion of pediatric cases among total number of patients notified in the Sakha Republic (Yakutia) for the period I was 15.6%, and 7.2% for the period II.
Prevalence of TB is a known indicator characterizing the TB infection reservoir in a region. Therefore, trends in pediatric TB prevalence in Sakha Republic were analyzed for two study periods (Table 3).
Table 2. Comparative characteristics of pediatric TB incidence trends in Sakha Republic between two observation periods (per 100,000 children)
|
Period I |
Period II |
||
|
Year |
Incidence |
Year |
Incidence |
|
1997 |
59.8 |
2007 |
31 |
|
1998 |
41.3 |
2008 |
29.9 |
|
1999 |
56.4 |
2009 |
22.8 |
|
2000 |
51.5 |
2010 |
21.8 |
|
2001 |
48.3 |
2011 |
29.6 |
|
2002 |
48.4 |
2012 |
32.5 |
|
2003 |
56.6 |
2013 |
22.6 |
|
2004 |
56.7 |
2014 |
23.6 |
|
2005 |
47.8 |
2015 |
20.5 |
|
2006 |
44.5 |
2016 |
20.7 |
|
Mean trend indicators:* |
|||
|
Mean level over time series |
51.0 |
25.5 |
|
|
Mean absolute rise/decline |
-1.7 |
-1.1 |
|
|
Mean rise rate/decline rate, % |
-3.2 |
-4.4 |
|
* Least squares method was used for alignment of time series.
Table 3. Comparative characteristics of pediatric TB prevalence trends in Sakha Republic between two observation periods (per 100,000 children)
|
Period I |
Period II |
||
|
Year |
Prevalence |
Year |
Prevalence |
|
1997 |
116.2 |
2007 |
34.4 |
|
1998 |
112.0 |
2008 |
26.1 |
|
1999 |
119.2 |
2009 |
24.7 |
|
2000 |
111.5 |
2010 |
30.6 |
|
2001 |
113.6 |
2011 |
39.3 |
|
2002 |
108.4 |
2012 |
40.3 |
|
2003 |
112.1 |
2013 |
28.7 |
|
2004 |
69.3 |
2014 |
30.6 |
|
2005 |
53.0 |
2015 |
20.0 |
|
2006 |
44.5 |
2016 |
27.0 |
|
Mean trend indicators:* |
|||
|
Mean level over time series |
96.0 |
30.2 |
|
|
Mean absolute rise/decline |
-8.0 |
-0.8 |
|
|
Mean rise rate/decline rate, % |
-10.1 |
-2.7 |
|
* Least squares method was used for alignment of time series.
As is seen, mean pediatric TB prevalence and prevalence decline rates in periods I and II were 96/100,000 and 10.1% vs 30.2/100,000 and 2.7%, respectfully. The highest values observed in periods I and II were, respectfully, 1119.2 (1999) and 40.3 (2012), and the lowest, respectfully, 44.5 (2006) and 20 (2015).
Correlation analysis between the rates of pediatric incidence and prevalence of TB over the period from 1997 to 2016 showed the presence of statistically significant correlation between the two indicators (r=0.847, p=0.001).
Primary TB infection prevalence is considered one of the most important indicators of the epidemiologic situation for TB. Results of the analysis of trends in primary infection prevalence are presented in Table 4.
Mean primary TB infection prevalence in children was 1432/100,000 in period I, which was 11.3% higher than in period II (1270.7/100,000), but decline rates of primary infection prevalence were higher in period II, compared to period I. The highest and lowest values of primary infection prevalence were 1650.8 (1999) and 1220 (2002) for the period I, and 1466.4 (2008) and 1050.3 (2011) for the period II.
Correlation analysis between primary TB infection prevalence and pediatric TB disease incidence established, that over the years 1997 to 2016, statistically valid correlation between the two indicators was observed (r=0.574, p=0.008), which signals the failures in preventive work among children with latent TB infection.
Table 4. Trends in pediatric primary TB infection prevalence in Sakha Republic, compared between two observation periods (per 100,000 pediatric population)
|
Period I |
Period II |
||
|
Year |
PIP |
Year |
PIP |
|
1997 |
1430.5 |
2007 |
1296.4 |
|
1998 |
1451.9 |
2008 |
1466.4 |
|
1999 |
1650.8 |
2009 |
1356.5 |
|
2000 |
1602.9 |
2010 |
1211.7 |
|
2001 |
1432.0 |
2011 |
1050.3 |
|
2002 |
1220.0 |
2012 |
1252.5 |
|
2003 |
1500.8 |
2013 |
1338.4 |
|
2004 |
1363.3 |
2014 |
1319.3 |
|
2005 |
1419.6 |
2015 |
1311.7 |
|
2006 |
1247.8 |
2016 |
1103.3 |
|
Mean trend indicators:* |
|||
|
Mean level over time series |
1432.0 |
1270.7 |
|
|
Mean absolute rise/decline |
-20.3 |
-21.5 |
|
|
Mean rise rate/decline rate, % |
-1.5 |
-1.8 |
|
* Least squares method was used for alignment of time series. PIP, primary infection prevalence.
Discussion
Long-term trends in key epidemiologic indicators for TB in the Extreme North region of Russia, the Sakha Republic (Yakutia), showed substantial changes over the period from 1997 to 2016. Overall stabilization trend started in 2000, and incidence and prevalence of TB started to decline in 2012. Over the period from 1997 to 2016, TB incidence in the republic reduced by 10%, prevalence reduced by 42.4%, and mortality decreased by 46.2%. Decline of TB mortality was more pronounced during the period from 2007 to 2016 (mean decline rate 5.6%). These findings confirm the stabilization of epidemiologic situation for TB in the Sakha Republic, with a gradual trend towards improvement.
Incidence of TB among pediatric population had significantly changed, as well, over the 20-year period. The first half of study period (1997-2006) is characterized with heightened mean TB incidence (51/100,000 children), and low decline rate (-3.2%), while the second half of study period (2007-2016) had low mean incidence of TB (25.5/100,000) and high decline rate (-4.4%). Data for the period from 1997 to 2016 show statistically reliable correlation between total TB incidence in general population and pediatric TB incidence (r=0.476, p=0.034). It should be acknowledged, that rise rates of pediatric TB incidence in Yakutia were higher, then in Russia, and had been steadily more than 4 times higher since 1997 and ever after.
Over the 20-year observation, significant changes in pediatric TB prevalence trends in Yakutia were observed, as well. Mean prevalence of TB in children was more than 3 times higher during the period I than that in the period II (96 vs 30.2 per 100,000 children). But decline rate of pediatric TB prevalence was higher in the period I (10.1% decline) compared to period II (2.7% decline). Primary TB infection prevalence, likewise, showed substantial difference between the two periods. Mean primary infection level was found to be 11.3% higher in period I, compared to period II (1432 vs 1270.7 per 100,000), but decline rate was higher in period II than in period I (-1.5 vs -1.8%).
In the Sakha Republic (Yakutia), the proportions of notified pediatric cases among the total number of detected new TB cases were 15.6% for study period I and 7.2% for period II. A research [12] showed that in 2000 pediatric cases made 9.6% in 22 countries with high TB burden; this is lower than period I proportion for Yakutia, but higher than period II proportion in Yakutia. Compared to data from other countries, in the Sakha Republic (Yakutia), the proportion of pediatric cases among total pool of notified TB cases was lower than in Pakistan (25.3%), Brazil (20.7%), and South Africa (16.1%), but higher than in Indonesia (2.7%), Vietnam (5.3%), and China (5.3%).
Our studies have confirmed the fact that the epidemiological situation of tuberculosis among children in a given region is directly dependent on the general tuberculosis epidemiological situation. When ranking all factors affecting the incidence of tuberculosis among children, the epidemiological factor is of decisive importance [9, 13, 14].
Conclusion
Despite some positive trend over long-term study of TB epidemiological process in the Sakha Republic (Yakutia), a region of Russia in the Extreme North, the problem of TB remains acute, which is apparent from high level of pediatric incidence. This calls for adopting such scientifically-grounded methodological approach to TB infection surveillance and monitoring, that would factor in regional specifics of those regions of Russia, which lie in the Extreme North.
Funding
This study was funded by the Academy of Sciences of the Sakha Republic (Yakutia) as part of the following research: “Multivariable research on the health status of the aboriginal and non-aboriginal population of the Sakha Republic (Yakutia), to optimize regional programs aimed at raising the quality of life of the residents of Yakutia, factoring in the distinct geographic and ethnic characteristics, and set in the context of modern-day socio-economic advancement” (Government contract no. 6512, issued September 6, 2017).
Ethical aproval
This article does not contain any studies with human participants or animals performed by any of the authors.
Conflict of interest
The author declares no conflict of interest.
Acknowledgments
The author expresses sincere gratitude to Tatyana Klimova and Lisa Burtseva for their assistance in preparing the article for publication.
- Vasilieva IA. Global reports on tuberculosis: compilation and interpretation. Tuberkulez i Bolezni Legkikh 2017; (5): 7-15. Russian. https://dx.doi.org/10.21292|2075-1230-2017-95-7-16.
- Levashev YuN, Sheremet AV, Grishko AN. Tuberculosis in the North-West Federal District. Problemy Tuberkuleza 2005; (11): 3-9. Russian. https://elibrary.ru/item.asp?id=29997456.
- Belilovsky EM, Borisov SE, Son IM, Nechaeva OB, Shalkin VB, Balasanyants GS, et al. Incidence of tuberculosis in Russian Federation. In: Kasaeva T.CH., et al. Tuberculosis in Russian Federation 2012/2013/2014. Analytical review of statistical indicators used in Russian Federation and in the world. Moscow, 2015: 29-74. Russian. https://elibrary.ru/item.asp?id=32478441.
- WHO. Global tuberculosis report, 2015. http://apps.who.int/iris/bitstream/handle/10665/191102/9789241565059_eng.pdf;jsessionid=6F5A8924D9524A22DC1C7AFA3FA82441?sequence=1.
- Shilova MV. Epidemiological situation with TB in Russian Federation and tactics of TB-care organization in initial period of its improvement. Meditsinskiy Alfavit 2016; 2(18): 5-12. Russian. https://elibrary.ru/item.asp?id=26738827.
- Alekseeva TV, Revyakina OV, Filippova OP, Krasnov VA. Tuberculosis in the Siberian and Far East Federal Districts (2007-2016). Tuberkulez i Bolezni Legkikh 2017; (8): 12-17. Russian. https://dx.doi.org/10.21292|2075-1230-2017-95-8-12-17.
- Lyalina VI, Li BB, Aleinikova LG, Ignatieva ME. Urgent problems in prevention of tuberculosis in the regions of the Extreme North. Meditsinskiy Al’yans 2015; (1): 44-45. Russian. https://elibrary.ru/item.asp?id=26140481.
- Tyrylgin MA. Problems in population health protection in the Extreme North. Novosibirsk, Russia: Nauka Publ., 2008; 302 p. Russian.
- Aksenova VA, Sterlikov SA, Belilovsky EM, Mushkin AYu, Slogotskaya LV, Danilova ID. Tuberculosis in children and adolescents. In: Kasaeva TCh, et al. Tuberculosis in Russian Federation 2012/2013/2014. Analytical review of statistical indicators used in Russian Federation and in the world. Moscow, 2015: 106-128. Russian. https://elibrary.ru/item.asp?id=32478434.
- Chabanova ON, Streltsova EN, Saifulin MKh. Clinical patterns of pediatric tuberculosis incidence in Arkhangelsk region. Tuberkulez i Bolezni Legkikh 2014; (8): 112-113. Russian. ttps://doi.org/10.21292/2075-1230-2014-0-8-112-113.
- Statistical yearbook of the Territorial Body of Federal State Statistics Service in the Sakha Republic (Yakutia). Yakutsk, Russia, 2017; 704 p. Russian.
- Nelson LJ, Wells CD. Global epidemiology of childhood tuberculosis. Int J Tuberc Lung Dis 2004; 8(5): 636-647. https://www.ncbi.nlm.nih.gov/pubmed/15137548.
- Mandal N, Anand PK, Gautam S, Das S, Hussain T. Diagnosis and treatment of paediatric tuberculosis: an insight review. Crit Rev Microbiol 2017; 43(4): 466-480. https://doi.org/10.1080/1040841X.2016.1262813.
- Marais BJ, Schaaf HS. Tuberculosis in children. Cold Spring Harb Perspect Med 2014; 4(9): a017855. https://doi.org/10.1101/cshperspect.a017855.
Received 29 June 2018, Revised 15 September 2018, Accepted 13 October 2018
© 2018, Luginova E.F.
© 2018, Russian Open Medical Journal
Correspondence to Evdokia Luginova. Phone: +7 (4112) 40-38-93. Mob.: +798142234737.
