Introduction
Ulcerative colitis (UC) results from a complex interaction between genetic, internal (intestinal microflora) and external (environment) factors [1]. The constant interest in UC lies in the fact that, despite a long history of study, the etiology of this disease remains unknown and today it remains one of the unresolved problems and mysteries in gastroenterology.
Genetic factors, of course, play an important role in the occurrence of UC [2]. At the same time, it is impractical to explain the occurrence of UC only by the genetic characteristics of the body, since they have remained relatively stable for hundreds of years while the incidence of IBD has increased [3]. The intestinal microbiome plays an important role in the development of UC. It has been evidenced that there is a decrease in the diversity of the intestinal microbiome in patients with UC; more precisely, this is a decrease in the proportion of microorganisms with anti-inflammatory activity, which synthesize short chain fatty acids, and an increase in the percentage of pathobiont bacteria [4]. Obviously, the increase in the number of patients with UC has occurred in parallel with the change in lifestyle and basic approaches to nutrition in modern society [5].
Modern dietary preferences largely influence intestinal microbiocinosis [6]. High sugar intake is believed to affect the diversity of the intestinal microbiome [7]. A study in mice, conducted in Canada, demonstrated that a 2-d diet with high sugar content alters the intestinal microbial composition (mainly due to microbes producing short chain fatty acids) and reduces microbial diversity, increasing proinflammatory cytokines and intestinal permeability as well as decreasing the intestinal ability to repair damaged colonic mucosa [8]. It is known that regular consumption of dietary fiber can prolong the remission of UC by increasing the production of short chain fatty acids [9]. A diet high in animal protein leads to excessive formation of sulfur, which affects not only the composition of the intestinal microbiome but also indirectly reduces the formation of mucin. With excessive consumption of red meat, sulfate-reducing bacteria secrete hydrogen sulfide, which directly affects the proliferation, apoptosis and differentiation of colon epithelial cells [10].
One study [11] has indicated the effect of red wine on the microbial composition of the intestines in healthy people. And, in another study [12], on the contrary, the scientists came to the conclusion that the consumption of meat and alcohol is associated with an increased risk of the UC backset, since many alcoholic drinks and meat contain high amounts of sulfates.
The objective of the study presented herein was to evaluate the influence of nutritional factors, alcohol and its varieties on the development risk of UC in adults of Western Siberia.
Material and Methods
Design of study
The nutritional habits’ profile of the UC patients from before the first symptoms of the disease appeared was analyzed in comparison to that of healthy respondents. A retrospective case control study was conducted using a questionnaire and interviewing method, as detailed below. The UC diagnosis was established on the basis of clinical manifestations and specific endoscopic and histological changes in the colon, according to the recommendations of the European evidence-based consensus on the diagnosis and management of UC, presented by the European Crohn's and Colitis Organisation (known as ECCO) [13], as well as to the clinical recommendations of the Russian Gastroenterological Association and the Association of Coloproctologists of the Russian Federation [14]. The study of nutrition and alcohol consumption in patients with UC before the disease’s first symptoms’ onset and in the healthy respondents was carried out using the standardized questionnaire from the World Health Organization (WHO) countrywide integrated noncommunicable diseases intervention (referred to as CINDI) program [15].
The survey included 13 questions regarding the consumption frequency and quantity of milk and fermented milk products, meat, fruits, vegetables, carbohydrate foods and sugar, as well as 11 questions regarding the consumption frequency and amount of alcoholic beverages and their varieties (see Appendix). Respondents were asked to choose one of the proposed answers. The consumption frequency and amount of alcohol was determined for each type of alcoholic beverage: beer, wine, and strong alcoholic beverages (vodka, cognac, whiskey). When calculating the consumption of pure ethanol for each respondent, the average consumption of each type of alcoholic beverage (in g/d) was calculated separately. Subsequently, the total consumption of pure ethanol per day was calculated for each respondent by summing the average values of the pure ethanol consumption per day for the various types of alcoholic beverages surveyed. When assessing the consumption of alcoholic beverages, the following mass (weight) concentrations of ethanol were used: for beer, 0.04 g of ethanol/mL of drink; for wine, 0.1227 g of ethanol/mL of drink; for strong alcoholic beverages, 0.3227 g of ethanol/mL of drink. The distribution of respondents by level of alcohol consumption was carried out according to the CINDI guidelines [14]: non-drinkers; consumers of small doses, up to 20 mL/d; excessive consumers, 20-39.9 mL/d for women and 20-59.9 mL/d for men; alcohol abusers, 60 or more mL/d for men and 40 or more mL/d for women.
Patients with UC
The “cases” group included patients with diagnosed UC who were hospitalized in the gastroenterological department of the Omsk Region Budgetary Healthcare Institution “Regional Clinical Hospital” during 2016-2018. All respondents gave their informed consent and were included in the study. The main group consisted of 81 patients (42 men and 39 women) with the UC diagnosis, with the age interval from 18 years to 79 years. The median age of patients at the time of the survey was 48.0 (32.0-60.0) years. Among the total patients, 49 (60.5±5.4%) were rural residents and 32 (39.5±5.4%) were Omsk city residents. The median age at the time of UC onset for all patients was 40.0 (28.0-54.0) years (for men, 40.5 years; for women, 32 years). The median time from the UC first symptoms’ onset to the diagnosis establishment was 6.0 (1.0-12.0) mo.
Healthy control subjects
The control group consisted of 39 healthy volunteers (14 men, 25 women) with an age interval from 22 years to 81 years, consisting of the researchers’ friends, comparable in age (U=13.38; P=0.1760) and gender (2I=2.72; P>0.05) with the group of patients with UC. Median age of the respondents was 46.0 (26.0-52.0) years. Men had median age of 36.0% ± 7.7% and women of 64.0%±7.7%. Among the total group, 22 (56.0±7.9%) lived in rural areas and 17 (44.0±7.9%) lived in Omsk.
Statistical analysis
To systematize and describe the obtained data, methods of descriptive statistics were used. To describe the groups by quantitative characteristics, the median with low and upper quartiles – Me (LQ-UQ) were used. The frequency of qualitative features is given in percent, taking into account the standard error of the indicator. To compare groups by quantitative characteristics, the Mann-Whitney U test was used. To compare the groups according to their qualitative characteristics, we used the calculation of 2I statistics (Kullback information statistics), considered as a variant of Nonparametric Analysis of Variance. The results were considered significant at P<0.05. Criteria for inclusion of patients in the study were UC diagnosis (hospitalized in the gastroenterological department of the Omsk Region Budgetary Healthcare Institution “Regional Clinical Hospital”) and agreement to participate in the study. To analyze statistical data, the statistical software “Statistica 6.1” was used.
Results
Tolerance of milk and fermented milk products
According to the obtained data, 27.2±4.9% of patients with UC tolerated milk and fermented milk products poorly before the disease’s first symptoms’ onset, significantly higher than among the healthy respondents. Bad tolerance of milk and fermented milk products was detected in only 7.7±4.3% of the healthy respondents (2I=9.72, P=0.011) (Figure 1).
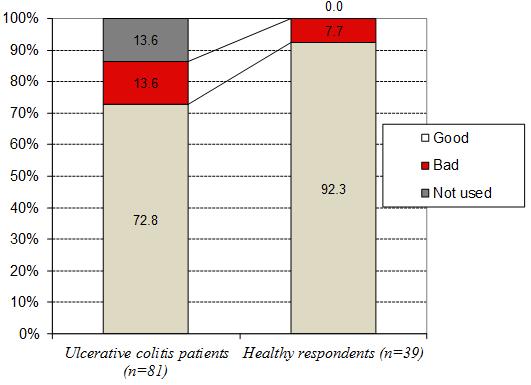
Figure 1. Tolerance of milk and fermented milk products by respondents.
Consumption of fruits and vegetables
According to WHO recommendations, the intake of vegetables and fruits should be more than 400 g per day [16]. Assessment of vegetable consumption was carried out on the basis of studying the consumption frequency of fresh and cooked (various types of cooking) vegetables as well as fresh fruits per week, per single intake, and the amount in grams eaten per single intake. Consumption features of fruits and vegetables among patients with UC before the disease’s first symptoms’ onset and healthy respondents are presented in Table 1.
Table 1. Features of the consumption of fruits and vegetables by respondents
|
Indices |
UС patients, n=81 |
Healthy respondents, n=39 |
Statistical significance of differences |
||
|
U |
Z |
P |
|||
|
Frequency of fresh fruit, once a week |
3.0 (1.0-4.0) |
5.0 (3.0-7.0) |
1081.5 |
-2.8 |
0.005 |
|
Amount of fruit eaten per single intake in g |
100.0 (100.0-200.0) |
200.0 (100.0-200.0) |
1219.0 |
-2.0 |
0.043 |
|
Amount of fruit eaten during 1 d, g |
42.9 (14.3-114.3) |
100.0 (57.1-200.0) |
958.0 |
-3.5 |
<0.001 |
|
Vegetable frequency, once a week |
7.0 (3.0-7.0) |
7.0 (4.5-7.0) |
1340.5 |
-1.3 |
0.181 |
|
Amount of vegetables eaten per single intake, g |
150.0 (100.0-200.0) |
200.0 (150.0-200.0) |
1161.5 |
-2.3 |
0.019 |
|
Amount of vegetables eaten during 1 d, g |
100.0 (57.1-200.0) |
160.0 (100.0-200.0) |
1167.0 |
-2.3 |
0.021 |
|
Number of fruits and vegetables eaten per 1 d, g |
200.00 (85.7-310.7) |
257.1 (186.4-450.0) |
1094.5 |
-2.7 |
0.007 |
Data presented as median with lower and upper quartiles – Me (LQ-UQ).
The obtained data indicated that patients with UC consumed significantly fewer fruits and vegetables, both per single intake and per day, as compared with the healthy respondents. Moreover, in both groups the amount of vegetables and fruits eaten per day (200.0 g in UC patients and 257.1 g in healthy individuals) was significantly less than the WHO recommendation [16].
Consumption of meat
Assessment of meat consumption before the disease’s first symptoms’ onset was carried out on the basis of the consumption frequency per week and per single intake (in grams). No statistically significant differences were found between the groups. The respondents of the two groups ate meat daily. The median at single intake was 200.0 g (100.0-200.0 g in the group of patients with UC; 125.0-200.0 g in the group of healthy respondents).
Spicy, fried and smoked foods consumption
We studied the frequency of spicy, fried and smoked foods consumption in the two groups and no statistically significant differences were found. Respondents consumed the indicated foods at an average of 2.0 (1.0-4.0) times a week.
Visiting fast food restaurants
According to the answers to the question “How often did you visit fast food restaurants before the first symptoms of the disease?”, no statistically significant differences were found between the groups (P=0.325). The median frequency of visits to fast food restaurants per year was 1.0 (0.0-12.0) for patients with UC and 2.0 (0.0-12.0) for the healthy respondents.
Consumption of sugar with tea and coffee, products containing sugar
We found that the patients with UC, before the disease’s first symptoms’ onset, statistically significantly (P=0.041) put more cubes (teaspoons) of sugar in one cup of tea and/or coffee (2.0 (1.0-3.0) teaspoons; 1.0 (1.0-2.0) teaspoon, respectively).
According to the answers to the questions “How often did you eat sweet treats: waffles, sweets, cakes, pastries, ice cream before the first symptoms of the disease?” and “How often did you drink sweet sodas before the first symptoms of the disease?”, there were no statistically significant differences between the groups.
Alcohol consumption
According to our study, the average age (median) of alcohol consumption in patients with UC was 19.0 (17-20) years and in healthy respondents was 18.0 (16-20) years (P=0.134). During the year before the onset of the first symptoms, 66.7±5.2% of the UC patients consumed alcohol. In the group of healthy respondents, 59.0±7.9% had consumed alcohol over the past 12 mo. Among the 66.7% of alcohol consumers with UC, there were no significant differences between women and men.
According to the interview, both the patients with UC before the first symptoms of the disease and the healthy respondents did not drink alcohol often (less than once a month, mainly on holidays). The median frequency of alcohol consumption in both groups was 0.1 (0.0-1.0) times a month. Thus, there were no statistically significant differences between the groups for the number of intakes of alcoholic beverages per month (P=0.798).
The frequency of consumption and the amount of alcohol were determined separately for each type of alcoholic beverage (beer, wine, strong alcoholic beverages). Features of the consumption for various types of alcoholic beverages consumed by patients with UC before the onset of the disease and healthy respondents are presented in Table 2.
Table 2. Alcohol consumption by respondents
|
Indices |
UC patients, n=81 |
Healthy respondents, n=39 |
Statistical comparison of the groups |
||
|
U |
Z |
P |
|||
|
Frequency of the beer consumption, once a month |
0.0 (0.0-1.0) |
0.3 (0.0-2.0) |
1317.0 |
-1.5 |
0.141 |
|
Amount of beer consumed per single intake, mL |
0.0 (0.0-500.0) |
150.0 (0.0-500.0) |
1471.0 |
-0.6 |
0.543 |
|
Frequency of wine consumption, once a year |
1.0 (0.0-1.0) |
2.0 (0.5-12.0) |
1042.0 |
-3.0 |
0.003 |
|
Amount of wine, consumed per single intake, mL |
100.0 (0.0–200.0) |
200.0 (20.0-250.0) |
1010.0 |
-3.2 |
0.001 |
|
Frequency of the strong alcoholic beverages consumption, once a month |
0.1 (0.0–1.0) |
0.1 (0.0-1.0) |
1534.0 |
0.3 |
0.798 |
|
Amount of the strong alcoholic beverages, consumed per single intake, mL |
50.0 (0.0–200.0) |
50.0 (0.0-100.0) |
1446.0 |
0.7 |
0.454 |
|
Amount of ethanol in beer consumed during 1 d, g |
0.0 (0.0–0.8) |
0.1 (0.0-1.7) |
1379.0 |
-1.1 |
0.261 |
|
Amount of ethanol in wine consumed during 1 d, g |
0.3 (0.0-0.5) |
1.1 (0.1-6.0) |
1007.0 |
-3.2 |
0.001 |
|
Amount of ethanol in strong alcoholic beverages consumed during 1 d, g |
0.1 (0.0-2.7) |
0.1 (0.0 -1.7) |
1503.5 |
0.4 |
0.670 |
|
Amount of ethanol consumed during 1 d, g |
0.0 (0.0-0.1) |
0.1 (0.0-0.7) |
1007.0 |
-3.2 |
0.001 |
Data presented as median with lower and upper quartiles – Me (LQ-UQ).
As it can be seen from Table 2, in the group of patients with UC before the disease onset and in healthy respondents, wine was the predominant type of the consumed alcohol. In this case, patients with UC before the first symptoms’ onset drank statistically less wine, both throughout the year (P=0.003) and during the day (P=0.001), as well as a smaller amount of wine per single intake (P=0.001), as compared to the control group. There were no statistically significant differences between the groups in the quantity and frequency of drinking strong alcoholic beverages and beer.
In our study, in both groups, excessive alcohol consumption according to CINDI criteria was not detected. Both the patients with UC before the diagnosis of the disease and the healthy respondents belonged to the group of non-drinkers or those who drink alcohol in small doses (up to 20 mL/d). Before diagnosis, the patients with UC consumed a smaller amount of pure alcohol during the day, compared with the healthy respondents, but we did not see a statistically significant difference.
Discussion
The influence of pathogenetic mechanisms of the diet on UC occurrence remains unknown, suggesting a direct effect on the composition of the colon microbiomes and indirect effects through the production of microbial metabolites, change in the local immune response, and dysfunction of the colonic mucosal barrier [17].
In this article, we show that in Western Siberia, the diet of patients with UC before the first symptoms of the disease is characterized by rare consumption and small portions of fresh or cooked vegetables and fruits. Patients with UC, before the first symptoms of the disease, consumed a greater amount of sugar with tea and/or coffee, compared to healthy respondents. Patients with UC did not tolerate milk and fermented milk products before the first symptoms of the disease. In the diets of patients with UC before diagnosing the disease and of the healthy respondents, there were no statistically significant differences in the consumption of meat, or spicy, fried, salted or smoked food as well as the frequency of visiting fast food restaurants.
The average age (median) of alcohol consumption among our study’s patients with UC is 19.0 years. During the year before the onset of the UC first symptoms, 66.7±5.2% of our patients with UC had consumed alcohol. The median frequency of the alcoholic beverages consumption in these patients with UC is less than once a month. Both in the group of UC patients and in the group of healthy respondents, wine is the predominant type of consumed alcohol. Patients with UC before the first symptoms of the disease drank statistically significantly less wine throughout the year and during the day, as well as a smaller amount of wine per single intake, compared to the control group. There were no statistically significant differences between the groups in the number and frequency of drinking strong alcoholic beverages and beer. For more convincing information, large-scale, long-term studies are required.
Probably, these nutritional habits and the consumption of alcoholic beverages have a significant effect on the intraspecific qualitative and quantitative diversity of the intestinal microbiome [18]. In the era of post-industrial society, the lifestyle of people with a genetic predisposition has a significant impact on the microbial composition of the intestine and leads to a change in the diversity of the intestinal microbiome on the background of UC, as well as a decrease in the number of resident flora and an increase in the number of potentially pathogenic and pathogenic microorganisms.
The diet in modern society is complex and diverse, which creates difficulties in assessing the contribution of individual nutrients to the occurrence of UC. The diet of people living in the Western Siberian region has features inherent in both Russian cuisine in general and local nutritional habits (pelmeni, pierogi, ukha, meat, cereals, potatoes, canned vegetables, mushrooms, berries, nuts). Such features of the diet in our region are due to the climate, the small development in agriculture (zone of risky agriculture), and well developed livestock breeding and hunting practices. Despite the fact that animal products have prevailed in the diet of the Western Siberian region’s inhabitants, the modern pace of life has brought its own corrections. In recent years, a change in nutritional habits has taken place in the Western Siberia region, or the so-called westernization of the nutrition; in general terms, it is characterized by insufficient nutritional fiber intake, excessive caloric intake, and high intake of saturated fats, canned foods, sugary soft drinks and instant foods. In this situation, it is necessary to create an evidence-based system for the prevention of UC.
Our study confirms the effects of dietary fibers’ deficiency and excess sugar intake in the diet on the occurrence of UC. Eating at least 400 g of fruits and vegetables per day (WHO recommendations) and reducing sugar intake with tea and/or coffee has a prophylactic effect on UC. The use of wine in small doses (no more than 20 mL/d) may have a protective effect in the development of UC. For more convincing information, large-scale long-term studies are required.
Conflict of interest
All authors declared that there are no conflicts of interest.
Ethical approval
The study was conducted in accordance with the Declaration of Helsinki by the World Medical Association and was approved by the Ethics Committee of the Omsk State Medical University (No. 74). All patients signed an informed consent form for participation in this study.
- Ye Y, Pang Z, Chen W, Ju S, Zhou C. The epidemiology and risk factors of inflammatory bowel disease. Int J Clin Exp Med 2015; 8(12): 22529-22542. https://pubmed.ncbi.nlm.nih.gov/26885239/.
- Uniken Venema WT, Voskuil MD, Dijkstra G, Weersma RK, Festen EA. The genetic background of inflammatory bowel disease: from correlation to causality. J Pathol 2017; 241(2): 146-158. https://doi.org/10.1002/path.4817.
- Ng S. Epidemiology of inflammatory bowel disease: focus on Asia. Best Pract Res Clin Gastroenterol 2014; 28(3): 363-372. https://doi.org/10.1016/j.bpg.2014.04.003.
- Hills RD Jr, Pontefract BA, Mishcon HR, Black CA, Sutton SC, Theberge CR. Gut Microbiome: Profound Implications for Diet and Disease. Nutrients 2019; 11(7): 1613. https://doi.org/10.3390/nu11071613.
- Kaplan GG. The global burden of IBD: from 2015 to 2025. Nat Rev Gastroenterol Hepatol 2015; 12(12):720-727. https://doi.org/10.1038/nrgastro.2015.150.
- Yatsunenko T, Rey F, Manary M, Trehan I, Dominguez-Bello M, Contreras M, et al. Human gut microbiome viewed across age and geography. Nature 2012; 486(7402): 222-227. https://doi.org/10.1038/nature11053.
- Parks B, Nam E, Org E, Kostem E, Norheim F, Hui S, et al. Genetic control of obesity and gut microbiota composition in response to high-fat, high-sucrose diet in mice. Cell Metab 2013; 17(1): 141-152. https://doi.org/10.1016/j.cmet.2012.12.007.
- Laffin M, Fedorak R, Zalasky A, Park H, Gill A, Agrawal A, et al. A high-sugar diet rapidly enhances susceptibility to colitis via depletion of luminal short-chain fatty acids in mice. Sci Rep 2019; 9(1): 12294. https://doi.org/10.1038/s41598-019-48749-2.
- Pituch-Zdanowska A, Banaszkiewicz A, Albrecht P. The role of dietary fibre in inflammatory bowel disease. Prz. Gastroenterol 2015; 10(3): 135-141. https://doi.org/10.5114/pg.2015.52753.
- Anantharaman K, Hausmann B, Jungbluth S, Kantor R, Lavy A, Warren L, et al. Expanded diversity of microbial groups that shape the dissimilatory sulfur cycle. ISME J 2018; 12(7): 1715-1728. https://doi.org/10.1038/s41396-018-0078-0.
- Jiménez-Girón A, Ibáñez C, Cifuentes A, Simó C, Muñoz-González I, Martín-Álvarez PJ, et al. Faecal metabolomic fingerprint after moderate consumption of red wine by healthy subjects. J Proteome Res 2015; 14(2): 897-905. https://doi.org/10.1021/pr500960g.
- Jowett SL, Seal CJ, Pearce MS, Phillips E, Gregory W, Barton JR, et al. Influence of dietary factors on the clinical course of ulcerative colitis: a prospective cohort study. Gut 2004; 53(10): 1479-1484. https://doi.org/10.1136/gut.2003.024828.
- Magro F, Gionchetti P, Eliakim R, Ardizzone S, Armuzzi A, Barreiro-de Acosta M, et al. Third European Evidence-based Consensus on Diagnosis and Management of Ulcerative Colitis. Part 1: Definitions, Diagnosis, Extra-intestinal Manifestations, Pregnancy, Cancer Surveillance, Surgery, and Ileo-anal Pouch Disorders. J Crohns Colitis 2017; 11(6): 649-670. https://doi.org/10.1093/ecco-jcc/jjx008.
- Ivashkin VT, Shelygin YuA, Khalif IL, Belousova EA, Shifrin OS, Abdulganieva DI, et al. Clinical guide of russian association of gastroenterology and russian association of coloproctology on diagnostics and treatment of ulcerative colitis. Koloproktologia 2017; (1): 6-30. Russian. https://www.ruproctology.com/jour/article/view/291.
- World Health Organization Regional Office for Europe. Protocol and guidelines. Countrywide Integrated Noncommunicable Diseases Intervention (CINDI) Programme. Copenhagen, Switzerland: WHO, 1995; 103 p. http://www.sld.cu/galerias/pdf/servicios/hta/carmen_programa_completo_ingles_111_pag.pdf.
- Diet, nutrition and the prevention of chronic diseases: report of a Joint WHO/FAO Expert Consultation. WHO Technical Report Series, No. 916. Geneva, Switzerland: WHO, 2003; 149 p. https://www.who.int/dietphysicalactivity/publications/trs916/download/en/.
- Khalili H, Chan SSM, Lochhead P, Ananthakrishnan AN, Hart AR, Chan AT. The role of diet in the aetiopathogenesis of inflammatory bowel disease. Nat Rev Gastroenterol Hepatol 2018; 15(9): 525-535. https://doi.org/10.1038/s41575-018-0022-9.
- Gentile C, Weir T. The gut microbiota at the intersection of diet and human health. Science 2018; 362(6416): 776-780. https://doi.org/10.1126/science.aau5812.
Received 3 February 2020, Revised 29 April 2020, Accepted 15 July 2020
© 2020, Bikbavova G.R., Livzan M.A., Turchaninov D.V., Sovalkin V.I., Akhmedov V.A.
© 2020, Russian Open Medical Journal
Correspondence to Galiya R. Bikbavova. Address: Omsk State Medical University, 12, Lenina Str, Omsk 644099, Russia. Phone: +79139885202. E-mail: galiya1976@mail.ru.