Introduction
Many studies confirmed the interaction between the respiration and oscillations in cardiovascular system [1, 2]. Both the characteristics of cardiorespiratory couplings [3] and interactions of various cardiovascular oscillatory processes have potential importance for medical diagnostics [4]. For fundamental and practical purposes, it is important to investigate the characteristics of coupling between the oscillatory rhythms in heart rate variability (HRV), photoplethysmographic waveform variability (PPGV) and respiration. The coupling can be characterized by its direction, strengths and time delay.
Cardiovascular and respiratory systems are interrelated, nonlinear and space-distributed objects. Dynamical noises and measurement artifacts introduce further complexity. To study the coupling patterns in such systems it is necessary to choose the most precise and robust methods of data analysis and to carefully set their parameters. The approaches based on analysis of instantaneous phases are perspective for such applications. External factors will cause significant changes in the instantaneous phase of the signal before any changes in the amplitudes become evident [5, 6]. For the analysis of biological data, many researchers use the methods based on phase dynamics modeling, which were first introduced in [7] and later modified and updated in [8, 9]. Phase dynamics modeling is particularly predominant in the analysis of complex brain potentials [10].
In the earlier studies, we estimated the strength and delay in coupling between the low-frequency oscillations (with main rhythm around 0.1 Hz) in heart rate variability and peripheral circulation. The dynamics of peripheral circulation was estimated from the photoplethysmogram (PPG) signals [11]. The study showed that in healthy subjects the influence heart rate ® PPG is faster than the influence in the opposite direction. However, the reliability of this result requires further investigations. The previous studies, including the studies on mathematical models, showed that the heart rate and PPG variability in the LF range are associated with the sympathetic control of heart rate [12-14] and vessels tone [15-17], respectively. Considering the coupling patterns between the LF variability rhythms in healthy subjects [4] it is reasonable to assume that one oscillatory process has a leading, dominant role.
The later study was aimed to adjust parameters of the methods to achieve better sensitivity and specificity in estimation of characteristics of coupling between the HRV and PPGV LF rhythms [18]. In that study, we refined the algorithms of pre-processing, instantaneous phases calculation, estimation of time scales over which the phase variation in modeled, estimation of needed length of the time series, the methods of statistical analysis. It was also revealed that investigation of time series longer than 20 minutes leads to significantly more precise estimations of coupling characteristics and lower dispersion of the estimations [19]. These results gave us ground to repeat the experimental study of coupling characteristics between the LF oscillations in HRV and PPGV to revaluate the data, previously obtained from shorter time series [11]. We also decided to include the investigation of the cardiorespiratory interactions and the collective dynamics of autonomic control during moderate physical exercises.
Aim of the study is to apply the phase dynamics modeling to the investigation of the characteristics of coupling between the low-frequency rhythms in heart rate variability, photoplethysmogram waveform variability and respiration. The study involved healthy subjects at rest and after moderate physical exercise.
Material and methods
Subjects
The study involved ten healthy subjects aged 22±2 (mean ± standard deviation). All subjects gave written consent to be involved in the study.
Design of the experiment
The ECG, PPG and respiration signals were recorded twice for each subject, before and right after the Martine Kushelevsky test (20 squats in 30 seconds). The signals were recorded for 30 minutes during the both phases. During the recording sessions, the subjects were sitting comfortably with their eyes closed in a temperature controlled room. Respiration was not controlled. The experiments took place at least two hours after the previous meal.
The ECG signals were recorded in the I standard lead, the PPG signals were recorded from distal phalange of the left ring finger with 960 nm infrared sensor in reflected light. The respiratory signals were recorded with standard abdominal resistive strain sensor. All signals were recorded with the standard certified registrator – Encephalan–EEGR–19/26 (Medicom MTD, Russia) at 16 bit resolution and 250 Hz frequency for each channel. Band pass filter was set to 0.003-80 Hz for the ECG and PPG signals and to 0.003-80 Hz for the respiratory signal.
Data analysis
For the analysis, only the ECG and PPG signals without artifacts or extra systoles were selected. The sequences of RR-intervals were extracted from the ECG signals. Equidistant cardiointervalogram (CIG) was then resampled from the RR-intervals with the cubic β-splines at 5 Hz. CIG was used as estimation of HRV.
For HRV, PPGV and respiratory signals we investigated the coupling characteristics using the coherence function and the phase dynamics modeling approach. The couplings between HRV and PPGV were investigated in 0.04-0.14 Hz range or so-called low-frequency (LF) range [20]. Couplings between the “HRV-respiration” and “PPGV-respiration” pairs of signals were investigated in 0.14-0.4 Hz range or so-called high-frequency (HF) range [20].
Calculation of the coherence function C(f) is based on the estimation of the cross-spectra and provides the characteristics of coupling between the spectral components of the signals [21]. The coherence function C(f) was group-averaged. Additionally, the sets of amplitude adjusted Fourier transform (AAFT) surrogate signals [22] were generated to control the statistical significance of the С(f). The results were considered significant if the C(f) was above the critical significance level at p=0.05. Only the statistically significant estimates of the Ĉ(f) were used for further analysis.
The coupling patterns and the characteristics were also investigated using the phase dynamics modeling approach [7]. The strengths of coupling in both directions was investigated (G(Δ2→1) and G(Δ1→2)) for different time lags Δ between the signals. Analytical approach from [23] was used to estimate the 95%-significance interval. The detected couplings were considered statistically significant if estimations of coupling “strengths” G(Δ2→1) or G(Δ1→2) with the 95%-confidence interval were not crossing the zero level. The phase dynamics models predicted the phase variation over t=10 seconds, and Δ was ranging from 0 to 4 seconds.
For each time lag Δ, group-averaged G(Δ2→1) and G(Δ1→2) were calculated with the corresponding standard deviations σG(Δ1→2) and σG(Δ2→1). Statistically insignificant results were excluded from the study.
Results
Figure 1 presents the group-averaged coherence functions Ĉ(f) for HRV, PPGV and respiratory signals before and after the physical exercises. As seen from the figure, the mean value of Ĉ(f) decreased after the active test. We then calculated the average decrease of Ĉ(f) and its standard deviation: for the coherence function between the LF rhythms in HRV and PPGV it was 0.017±0.006 (Figure 1b) and for the HF rhythms in PPGV and respiration it was 0.012±0.004 (Figure 1c). Most prominent decrease (0.060) of Ĉ(f) was observed for the 0.1 Hz-rhythms in HRV and PPGV (Figure 1a). For 0.3 Hz-rhythms in respiration and HRV, the decrease of Ĉ(f) was 0.042 (Figure 1b), while for the 0.3 Hz-rhythms in respiration and PPGV, it was 0.023 (Figure 1c).
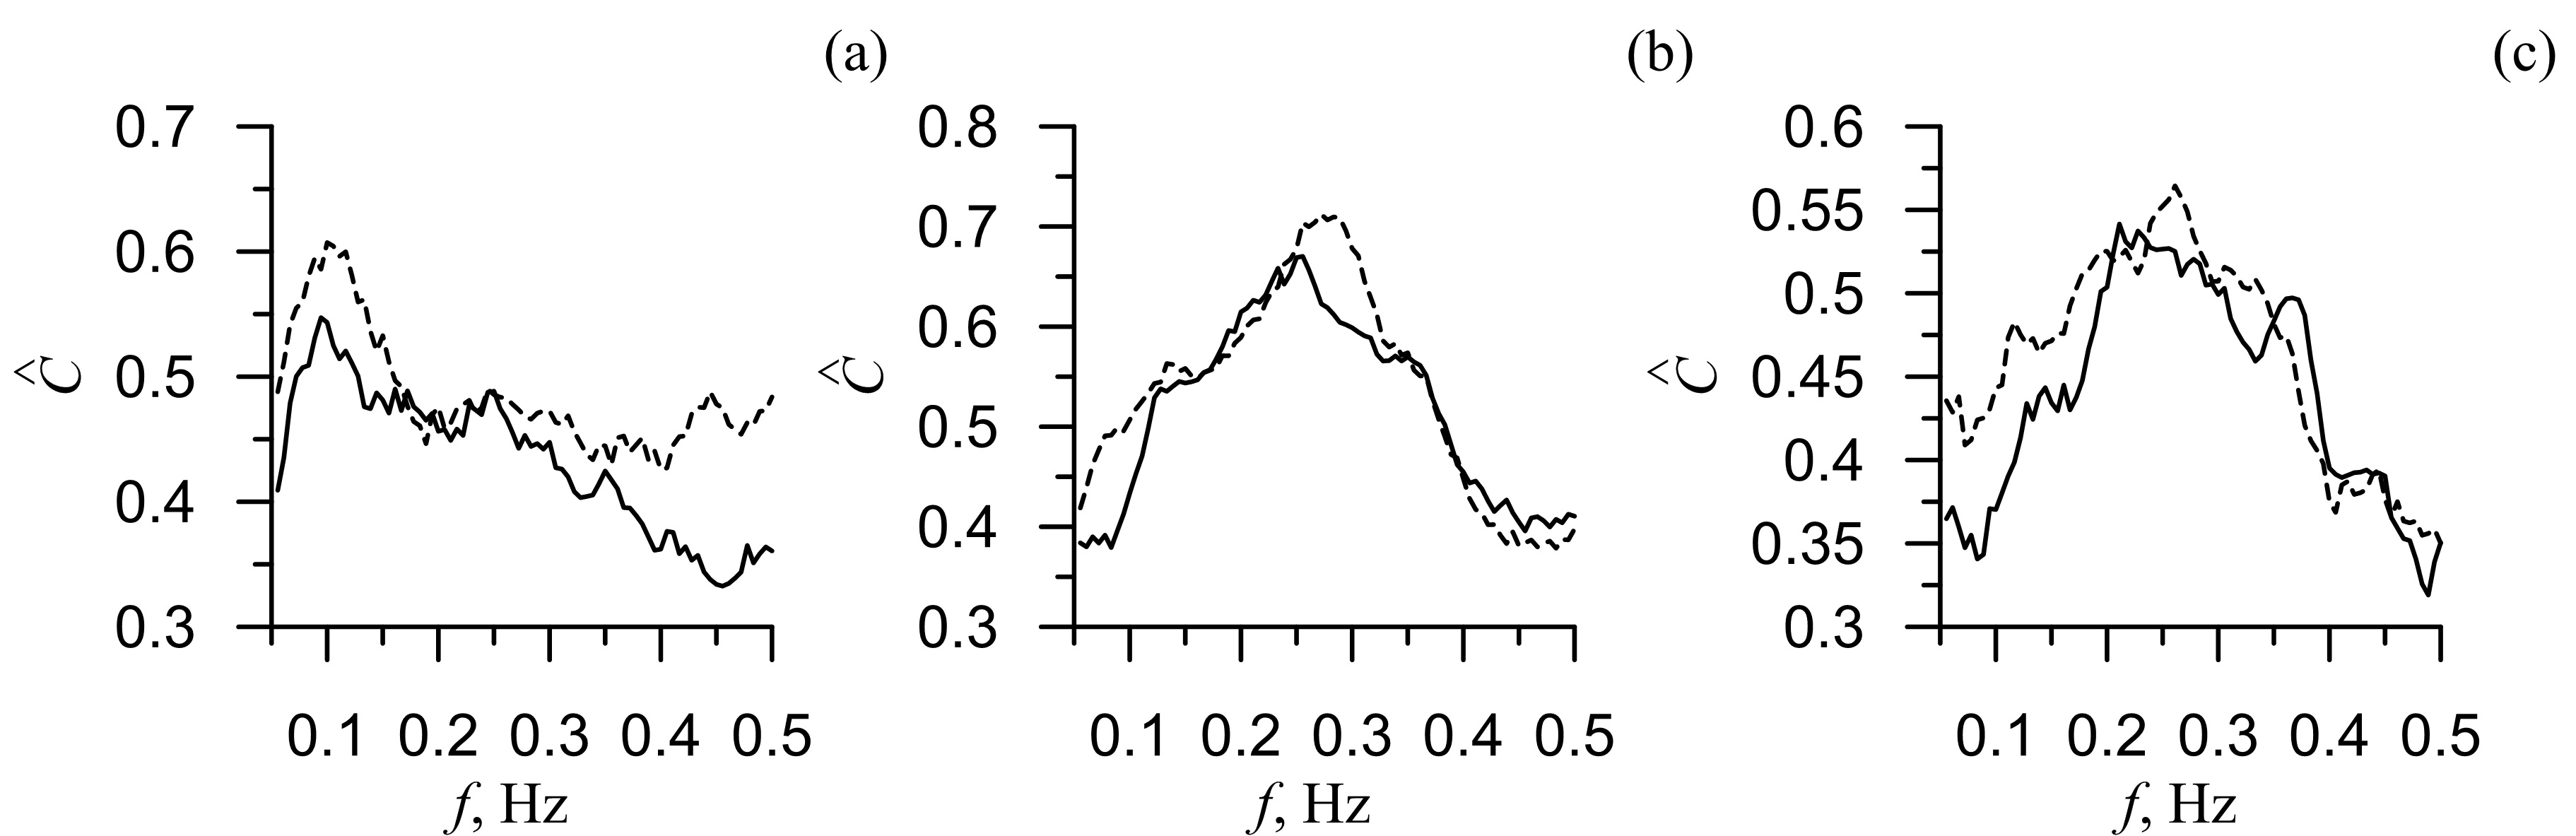
Figure 1. The group-averaged coherence functions Ĉ(f) between PPG and CIG (a), respiration and CIG (b), respiration and PPG (c). Dashed line is the coherence function before the physical exercises and solid line is the coherence function after the physical exercises. G(Δ2→1) and G(Δ1→2)
Figure 2 presents the estimated strength of the directional coupling between the LF and HF rhythms of HRV, PPGV and respiratory signals before and after the active tests. From Figure 2(a, d) it is evident that before the test no coupling is detected between the HRV and PPGV (Figure 2а). After the test, the coupling was detected; predominantly it was the influence HRV ® PPGV (Figure 2d).
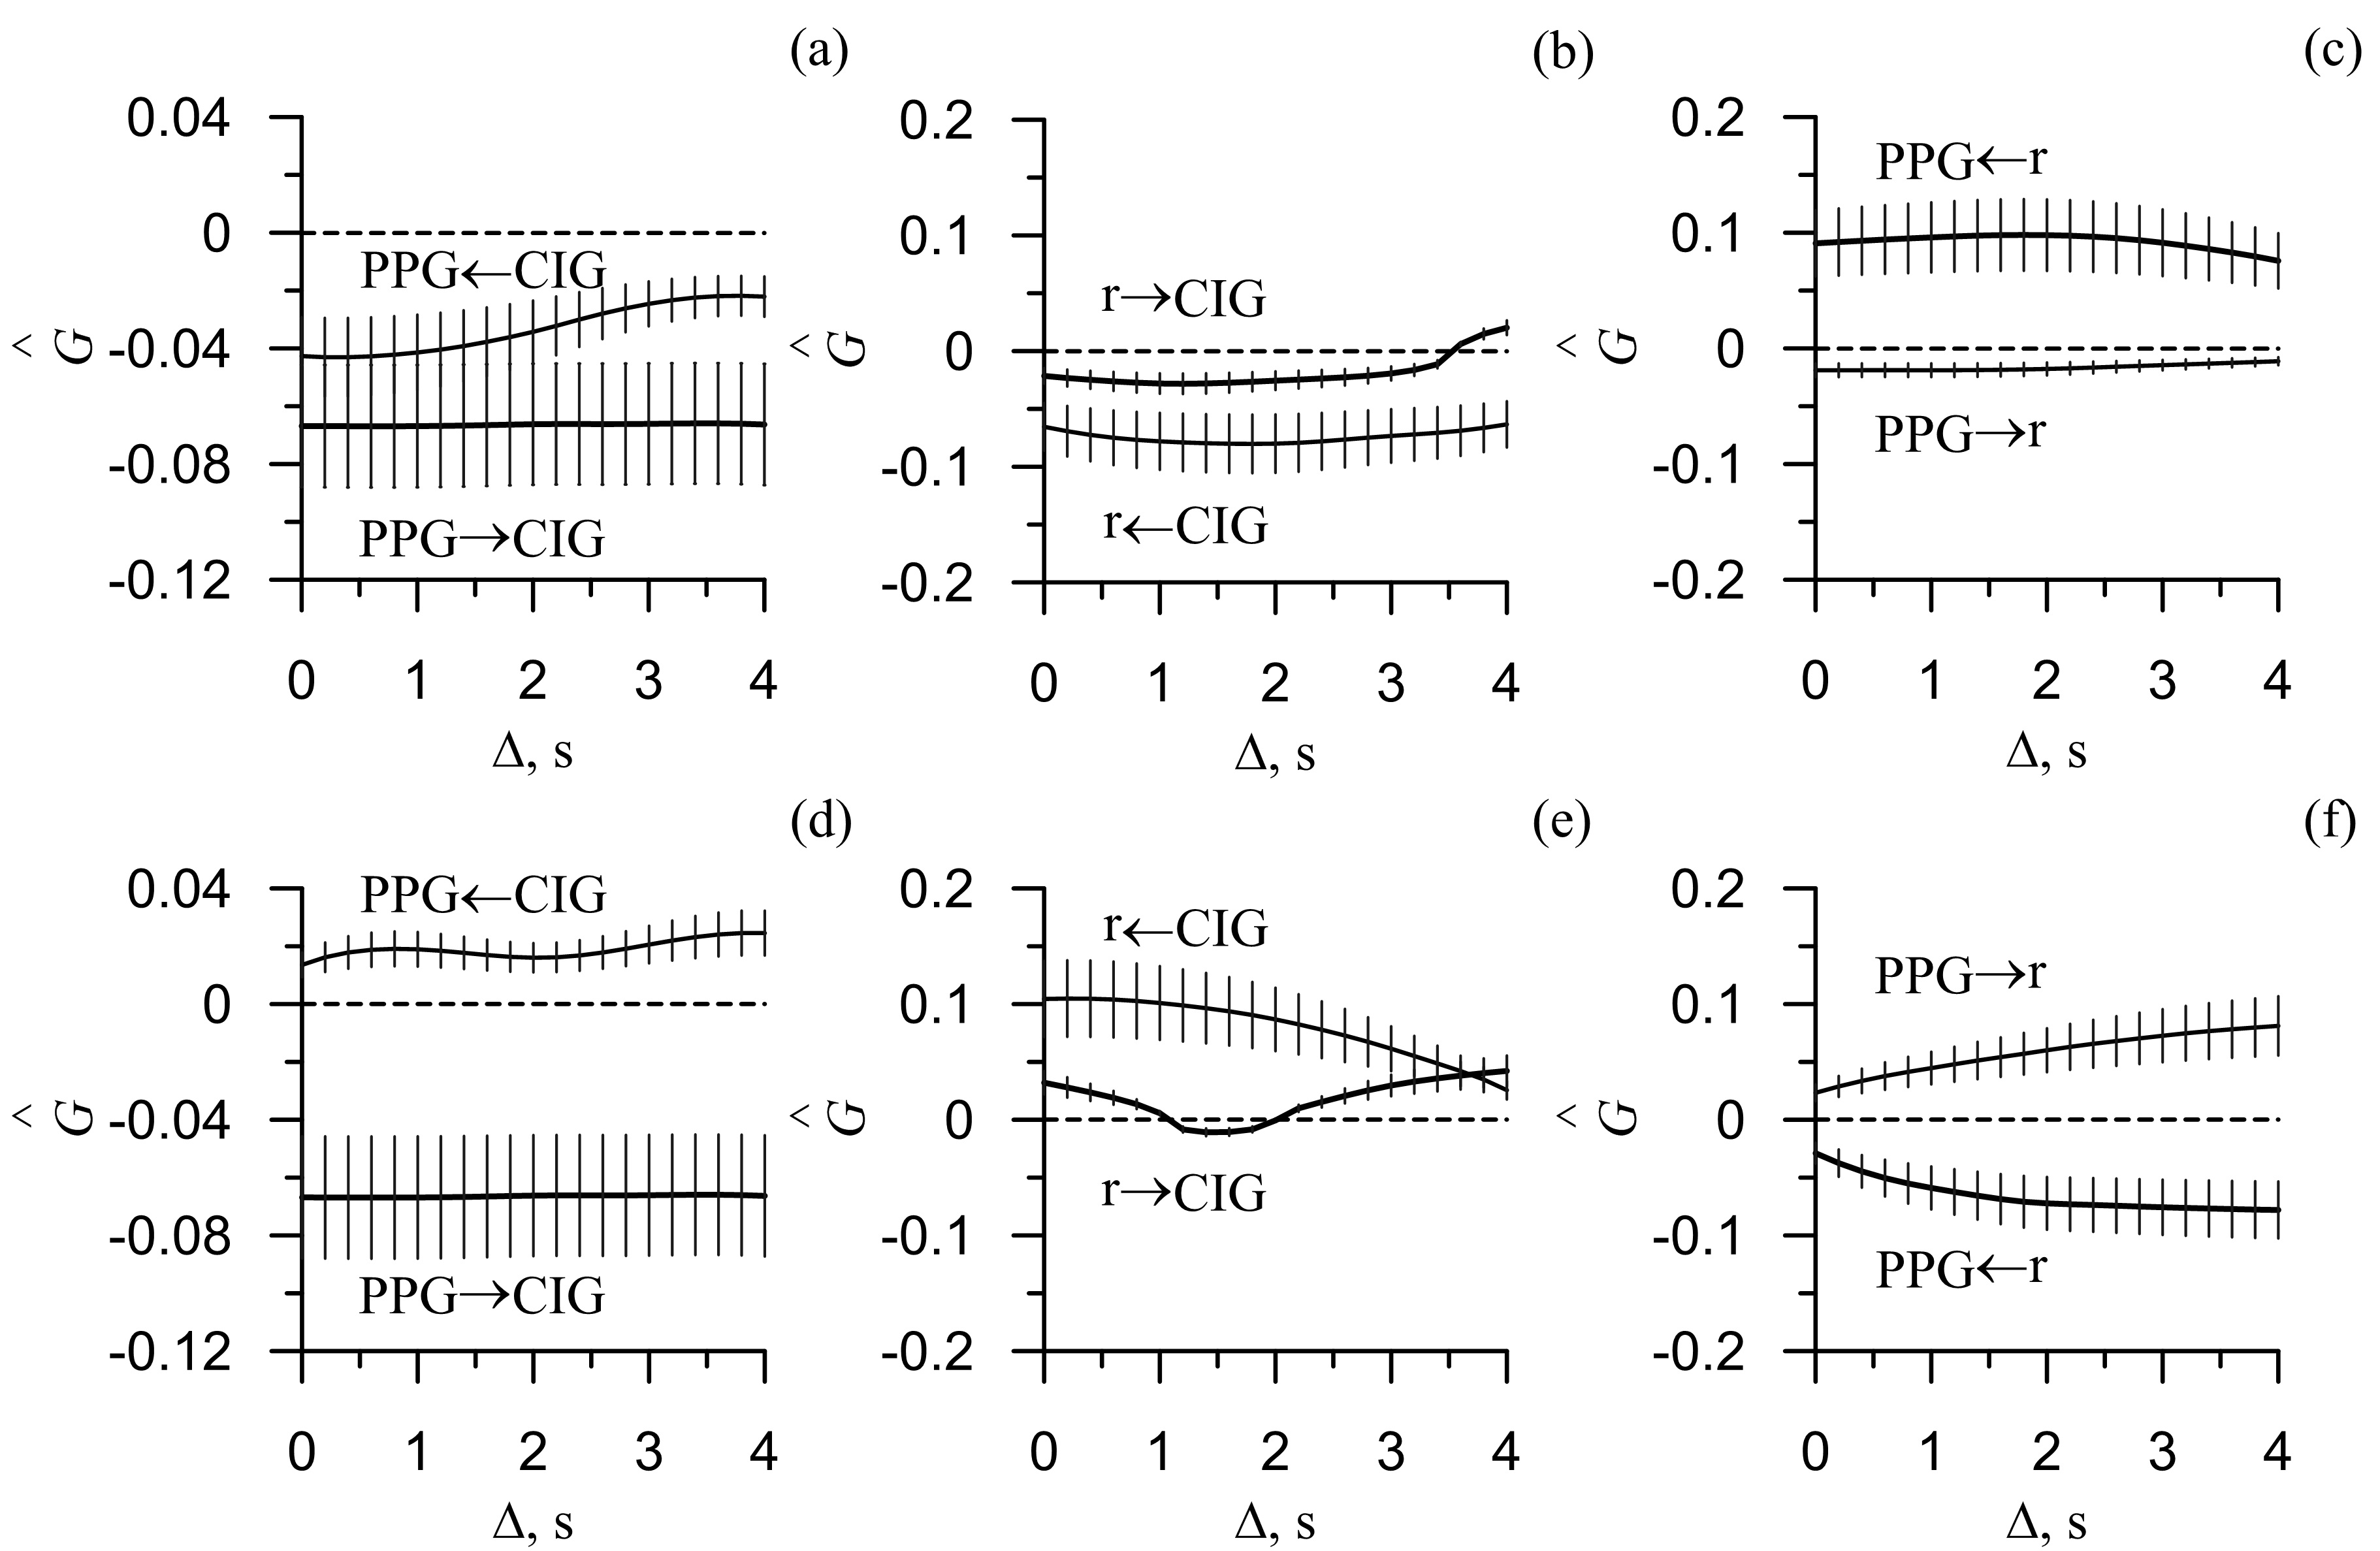
Figure 2. Results of the directional coupling detection using the phase dynamics modeling approach: (a) and (d) coupling between PPG and CIG, (b) and (e) coupling between respiration and CIG, (c) and (f) coupling between respiration and PPG. (a, b, c) coupling calculated before the physical exercise and (d, e, f) coupling calculated after the exercises. The solid line marks the group-averaged estimates of coupling strengths in both directions, σG(Δ1→2) and σG(Δ2→1). The vertical lines marks the standard deviation σG(Δ1→2) and σG(Δ2→1). The dashed lines mark the zero level. If σG(Δ1→2) or σG(Δ2→1) with the respective standard deviation σG(Δ1→2) or σG(Δ2→1) was larger than the zero level we assumed the coupling to be statistically significant for the respective time lag Δ.
From Figure 2(b, e) it is evident that before the test no couplings were detected between the HRV and respiration (Figure 2b). After the test, the coupling was detected in both directions; predominantly it was the influence HRV ® respiration (Figure 2e).
From Figure 2(c, f) it is seen that before the test the influence respiration ® PPGV is detected (Figure 2c). After the active test, the predominant coupling was detected in the opposite direction (Figure 2e). Moreover, Figure 2(e) shows several seconds delay in the influence PPGV ® respiration. It argues for the complexity of coupling pattern between the investigated signals.
Discussion
Understanding the dynamics of coupling between the rhythms of heart rate variability, peripheral circulation and respiration is important for the fundamental understanding of the circulation physiology. The study aimed to investigate this dynamics in healthy subjects before and after the moderate physical exercise. To estimate the activity of peripheral circulation, we investigated the PPG signals, because of their close relation to the blood filling of peripheral vessels [24].
The LF oscillations are present in a number of cardiovascular signals, including heart rate, arterial pressure and peripheral blood filling [15, 25-29]. The LF rhythms in heart rate and arterial pressure are caused by baroreflectory control [12-14]. The LF rhythms in PPGV are caused by the sympathetic control [15-17, 30] of the vessels’ tone, oscillations of vessels’ wall that have local myogenic origin [30], and variability in the blood flow through the distal arteries [31]. In [32] it is stated that the LF oscillations in HRV and PPG are functionally independent, but in healthy subjects they are synchronized for a majority of time [4]. In the patients with cardiovascular conditions, the level of synchronization is decreased that is potentially important for clinical applications [4].
The study revealed that in healthy subjects, before physical activity there are no couplings between the LF rhythms in HRV and PPGV. After the physical activity, the statistically significant influence HRV ® PPG appeared which may suggest that autonomic control of heart rate is dominant in the regulation of vessels’ tone during the adaptation period. The study also revealed the significant influence respiration ® PPGV in the HF range. The revealed coupling can be explained by the fact that the HF rhythms in PPGV are passively affected by respiration [33].
After the moderate physical exercise, the coupling between the PPGV and respiration changes its direction. Since respiratory wave is mainly related to the venular flow, rise of its amplitude is a sign of decreased venous return [34]. We assume that decreased influence of respiration on PPGV is related to the increase in microcirculation after the physical activity. Analysis of the influence PPGV ® respiration revealed a time delay of several seconds. This result argues for the complexity of the coupling patterns in cardiovascular system.
For the HF rhythms in respiration and heart rate, we detected no significant coupling before the physical activity. However, after the active test, we detected the coupling in both directions with dominant influence HRV ® respiration. The coupling pattern of such complexity may be caused by the mechanical stimulation from the rib cage, since physical activity leads to deeper and faster respiration, and, therefore, to strengthened suction of a rib cage and increased venous return [35]. Another explanation is increased parasympathetic activity. Many researchers linked the HF rhythms in HRV with respiration and parasympathetic activity [20].
The decrease of the coherence function after the moderate physical exercise may be explained by the increased role of local control mechanisms.
We assume that obtained results can help in understanding of the adaptation dynamics that occurs in cardiovascular system in response to the moderate physical exercises. The results also confirm the nonlinearity and complexity of the coupling patterns, which can show a time delay of up to several seconds.
Conclusion
Adaptation of the cardiovascular system to the moderate physical exercises has led to the decrease in the average level of coherence and to changes in the directional coupling patterns between the HF and LF rhythms in respiration, heart rate and peripheral circulation. In particular, moderate physical activity has led to manifestation of the coupling between the LF rhythms in HRV and PPGV signals. Dominant direction of coupling was from HRV to PPGV. After the physical activity, the HF rhythms in both HRV and PPGV started affecting the HF rhythms in respiration. The coupling between the PPGV and respiration was delayed by several seconds that confirms the complexity of coupling patterns between the respiration and peripheral circulation.
Limitations
Detection of weak coupling between the noisy nonlinear oscillations is a non-trivial task. We applied the most precise methods of weak coupling detection. However, we sacrificed a part of precision in order to achieve statistically significant results. Statistical insignificance of the detected couplings doesn’t necessarily mean their absence. It only means that the data is insufficient to prove the presence of couplings. The insignificance of the results may be caused by high level of noises, weakening of coupling or absence of oscillations in the investigated ranges.
Such conditions require cautious interpretation of the absolute values of delays in couplings. Therefore we didn’t give much attention to the exact values of this parameter.
Funding
The reported study was funded by the grant of the President of the Russian Federation, project No. MD-418.2019.7.
Conflict of interest
The authors declare that they have no conflict of interest.
- Larsen PD, Tzeng YC, Sin PY, Galletly DC. Respiratory sinus arrhythmia in conscious humans during spontaneous respiration. Respir Physiol Neurobiol 2010; 174(1-2): 111-118. https://doi.org/10.1016/j.resp.2010.04.021.
- Krause H, Kraemer JF, Penzel T, Kurths J, Wessel N. On the difference of cardiorespiratory synchronisation and coordination. Chaos 2017; 27(9): 093933. https://doi.org/10.1063/1.4999352.
- Garcia AJ 3rd, Koschnitzky JE, Dashevskiy T, Ramirez JM. Cardiorespiratory coupling in health and disease. Auton Neurosci 2013; 175(1-2): 26-37. https://doi.org/10.1016/j.autneu.2013.02.006.
- Kiselev AR, Karavaev AS, Gridnev VI, Prokhorov MD, Ponomarenko VI, Borovkova EI, et al. Method of estimation of synchronization strength between low-frequency oscillations in heart rate variability and photoplethysmographic waveform variability. Russian Open Medical Journal 2016; 5: e0101. https://doi.org/10.15275/rusomj.2016.0101.
- Bezruchko BP, Smirnov DA. Mathematical modeling and chaotic time series. Saratov, Russia: Kolledzh, 2005; 320 p. Russian. http://window.edu.ru/resource/975/29975/files/sgu029.pdf
- Bezruchko BP, Smirnov DA. Extracting knowledge from time series. An introduction to nonlinear empirical modeling. Springer-Verlag Berlin Heidelberg, 2010; 410 p. https://doi.org/10.1007/978-3-642-12601-7.
- Rosenblum MG, Pikovsky AS. Detecting direction of coupling in interacting oscillators. Phys Rev E Stat Nonlin Soft Matter Phys 2001; 64(4 Pt 2): 045202. https://doi.org/10.1103/PhysRevE.64.045202.
- Smirnov DA, Bezruchko BP. Detection of coupling in ensembles of stochastic oscillators. Phys Rev E Stat Nonlin Soft Matter Phys 2009; 79(4 Pt 2): 046204. https://doi.org/10.1103/PhysRevE.79.046204.
- Smirnov DA, Sidak EV, Bezruchko BP. Detection of coupling between oscillators with analytic tests for significance. Eur Phys J Special Topics 2013; 222: 2441-2451. https://doi.org/10.1140/epjst/e2013-02028-5.
- Tass P, Smirnov D, Karavaev A, Barnikol U, Barnikol T, Adamchic I, et al. The causal relationship between subcortical local field potential oscillations and parkinsonian resting tremor. J Neural Eng 2010; 7(1): 16009. https://doi.org/10.1088/1741-2560/7/1/016009.
- Kiselev AR, Khorev VS, Gridnev VI, Prokhorov MD, Karavaev AS, Posnenkova OM, et al. Interaction of 0.1-Hz oscillations in heart rate variability and distal blood flow variability. Hum Physiol 2012; 38(3): 303-309. https://doi.org/10.1134/S0362119712020107.
- Kotani K, Struzik ZR, Takamasu K, Stanley HE, Yamamoto Y. Model for complex heart rate dynamics in health and diseases. Phys Rev E Stat Nonlin Soft Matter Phys 2005; 72(4 Pt 1): 041904. https://doi.org/10.1103/PhysRevE.72.041904.
- Ringwood JV, Malpas SC. Slow oscillations in blood pressure via a nonlineare feedback model. Am J Physiol Regul Integr Comp Physiol 2001; 280(4): R1105-R1115. https://doi.org/10.1152/ajpregu.2001.280.4.R1105.
- Ursino M, Magosso E. Short-term autonomic control of cardiovascular function: a mini review with the help of mathematical models. J Integr Neurosci 2003; 2(2): 219-247. https://doi.org/10.1142/s0219635203000275.
- Bernardi L, Radaelli A, Solda PL, Coats AJ, Reeder M, Calciati A, et al. Autonomic control of skin microvessels: assessment by power spectrum of photoplethysmographic waves. Clin Sci (Lond) 1996; 90(5): 345-355. https://doi.org/10.1042/cs0900345.
- Middleton PM, Chan GS, Steel E, Malouf P, Critoph C, Flynn G, et al. Fingertip photoplethysmographic waveform variability and systemic vascular resistance in intensive care unit patients. Med Biol Eng Comput 2011; 49(8); 859-866. https://doi.org/10.1007/s11517-011-0749-8.
- Middleton PM, Tang CH, Chan GS, Bishop S, Savkin AV, Lovell NH. Peripheral photoplethysmography variability analysis of sepsis patients. Med Biol Eng Comput 2011; 49(3): 337-347. https://doi.org/10.1007/s11517-010-0713-z.
- Sidak EV, Smirnov DA, Osipov GV, Bezruchko BP. Influence of nonlinear amplitude dynamics on estimated delay time of coupling between self-oscillatory systems. Tech Phys Lett 2016; 42(3): 287-290. https://doi.org/10.1134/S1063785016030317.
- Khorev VS, Ishbulatov JM, Lapsheva EE, Kiselev AR, Gridnev VI, Bezruchko BP, et al. Diagnostics of directional coupling between blood circulation regulation loops using analysis of time series of mathematical model of human cardiovascular system. Informatsionno-Upravliaiushchie Sistemy 2018; (1(92)): 42-48. Russian. https://doi.org/10.15217/issn1684-8853.2018.1.42.
- Heart rate variability: standards of measurement, physiological interpretation, and clinical use. Task Force of the European Society of Cardiology the North American Society of Pacing Electrophysiology. Circulation 1996; 93(5): 1043-1065. https://doi.org/10.1161/01.CIR.93.5.1043.
- Bendat JS, Piersol AG. Random data: analysis and measurement procedures, 4th Edition. USA: Wiley, 2010; 640 p. http://doi.org/10.1002/9781118032428.
- Schreiber T, Schmitz A. Improved surrogate data for nonlinearity tests. Phys Rev Lett 1996; 77(4): 635-638. https://doi.org/10.1103/PhysRevLett.77.635.
- Smirnov DA, Bezruchko BP. Estimation of interaction strength and direction from short and noisy time series. Phys Rev E Stat Nonlin Soft Matter Phys 2003; 68(4 Pt 2): 046209. https://doi.org/10.1103/PhysRevE.68.046209.
- Allen J. Photoplethysmography and its application in clinical physiological measurement. Physiol Meas 2007; 28(3): R1-R39. https://doi.org/10.1088/0967-3334/28/3/R01.
- Bernardi L, Passino C, Spadacini G, Valle F, Leuzzi S, Piepoli M, et al. Arterial baroreceptor as determinants of 0.1 Hz and respiration-related changes in blood pressure and heart rate spectra. In: Frontiers of blood pressure and heart rate analysis. Amsterdam: IOS Press, 1997; 5: 241-245. https://doi.org/10.3233/978-1-60750-879-3-241.
- Bernardi L, Rossi M, Fratino P, Finardi G, Mevio E, Orlandi C. Relationship between changes in human skin blood flow and autonomic tone. Microvasc Res 1989; 37(1): 16-27. https://doi.org/10.1016/0026-2862(89)90069-1.
- Bernardi L, Rossi M, Leuzzi S, Mevio E, Fornasari G, Calciati A, et al. Reduction of 0.1 Hz microcirculatory fluctuations as evidence of sympathetic dysfunction in insulin-dependent diabetes. Cardiovasc Res 1997; 34(1): 185-191. https://doi.org/10.1016/s0008-6363(97)00017-5.
- Whittam AM, Claytont RH, Lord SW, McComb JM, Murray A. Heart rate and blood pressure variability in normal subjects compared with data from beat-to-beat models developed from de Boer’s model of the cardiovascular system. Physiol Meas 2000; 21(2): 305-318. https://doi.org/10.1088/0967-3334/21/2/310.
- Wray DW, Fadel PJ, Keller DM, Ogoh S, Sander M, Raven PB, et al. Dynamic carotid baroreflex control of the peripheral circulation during exersice in humans. J Physiol 2004; 559(Pt 2): 675-684. https://doi.org/10.1113/jphysiol.2004.066183.
- Krupatkin AI. Blood flow oscillations – new diagnostic language in microvascular research. Regional Blood Circulation and Microcirculation 2014; 13(1(49)): 83-99. Russian. https://elibrary.ru/item.asp?id=21400409.
- Rhee S, Yang BH, Asada H. Theoretical evaluation of the influence of displacement on finger photoplethysmography for wearable health monitoring sensors. In: ASME International Mechanical Engineering Congress and Exposition, Symposium on Dynamics, Control, and Design of Biomechanical Systems. Nashville, Tennessee, November 14–19, 1999. http://citeseerx.ist.psu.edu/viewdoc/download?doi=10.1.1.575.6125&rep=rep1&type=pdf.
- Karavaev AS, Prokhorov MD, Ponomarenko VI, Kiselev AR, Gridnev VI, Ruban EI, et al. Synchronization of low-frequency oscillations in the human cardiovascular system. Chaos 2009; 19(3): 033112. https://doi.org/10.1063/1.3187794.
- Tyurina MY, Krasnikov GV, Tankanag AV, Piskunova GM, Chemeris NK. Spectra of heart rate deviations under controlled breath conditions in human. Regional Blood Circulation and Microcirculation 2011; 10(2(38)): 64-70. Russian. https://elibrary.ru/item.asp?id=16516319.
- Bergersen TK, Hisdal J, Walløe L. Perfusion of the human finger during cold-induced vasodilatation. Am J Physiol 1999; 276(3): R731-R737. https://doi.org/10.1152/ajpregu.1999.276.3.R731.
- Michard F. Changes in arterial pressure during mechanical ventilation. Anesthesiology 2005; 103(2): 419-428. https://doi.org/10.1097/00000542-200508000-00026.
Received 12 August 2019, Revised 30 September 2019, Accepted 15 October 2019
© 2019, Kiselev A.R., Borovkova E.I., Simonyan M.A., Ishbulatov Y.M., Ispiryan A.Yu., Karavaev A.S., Navrotskaya E.V., Shvartz V.A.
© 2019, Russian Open Medical Journal
Correspondence to Anton R. Kiselev. Address: Research Institute of Cardiology, Saratov State Medical University, 112, Bolshaya Kazachya str., Saratov, 410012, Russia. E-mail: kiselev@cardio-it.ru.