Introduction
Melanoma is one of the most aggressive forms of cancer and is capable of rapid metastasis [1], after which the 5-year survival rate is decreases from 97% to 10-15 % [1]. Therefore, effective treatment is only possible during the early stages of the illness and development of new diagnostic techniques is paramount.
The recent studies [2] showed the effectiveness of the photoacoustic microscopy-cytometry the early detection of cancer cells. This noninvasive approach promises very high sensitivity since it is potentially capable to detect even single cancer cells in tissue and blood background.
The currently one of adopted diagnostic methods are based on the analysis of the blood samples called also liquid biopsy. However, on the early stages of cancer only small amount of tumor cells are presented in blood samples and the volume of the blood samples cannot surpass 50 ml. Number of cancer cells in the blood samples is lowered further during the preanalysis phase. Resulting probability of the cancer detection is only 47% [3].
The modern invasive diagnostics of cancer cells involve injection of probing catheter into the major arteries and provides 58% detection rate [4]. However invasive techniques are prone to cause side effects, mainly the blood clotting [5-7].
In 2005-2007 several research groups proposed the method of integrated photoacoustic microscopy-cytometry based on detection of acoustic responses from individual cancer cells, which are exposed to laser pulses. Similar methods were already adapted to the gas spectroscopy [8], monitoring of lymph nodes [9] and the breast cancer tumors visualization [10]. In 2009 [11] the photoacoustic platform was developed to detect tumor cells (CTC) in blood.
The tumor cells absorb the laser energy; the heat absorption leads to expansion of the cells, and is accompanied by generation of the acoustic waves through photoacoustic effect. The melanoma cells are darker and absorb greater amount of laser energy, in some cases they are even destroyed by absorbed energy and release micro-bubbles [2]. Both situations result in generation of the more intense nonlinear acoustic response. Development of precise algorithms to analyze the acoustic responses will provide a tool for noninvasive detection of single tumor cells than can dramatically increase the sensitivity of early melanoma diagnostics [2].
We explored and compared the spectral properties of the acoustic responses from normal blood cells, and B16F10 melanoma cells in polyurethane tube, including spectral power distribution and assessment of the signal-to-noise ratio. The obtained results were used to develop the recommendation for further improvement of sensitivity and noise resistance of the diagnostics techniques.
Material and Methods
We analyzed the signals obtained using resonance acoustic piezosensor Imasonic S.A. custom 3.5 MHz single element transducer (IMASONIC SAS, France). Bandwidth of the sensor was limited from above at 6 MHz at -3 dB level. The sensor had the internal preliminary intensifier which output was digitized using Alazar ATS9350 ADC with sample rate of 500 Msps, 12 bit resolution and 250 MHz bandwidth. Duration of the analyzed acoustic signals (waveforms) was 16 µs. The beginning of each waveform was synchronized using pulsed laser with wavelength of 1064 nm, pulse duration of 2 ns, pulse repetition rate of 2 kHz and pulse energy of 100 µJ. The structure of the experimental setup is presented in Figure 1.
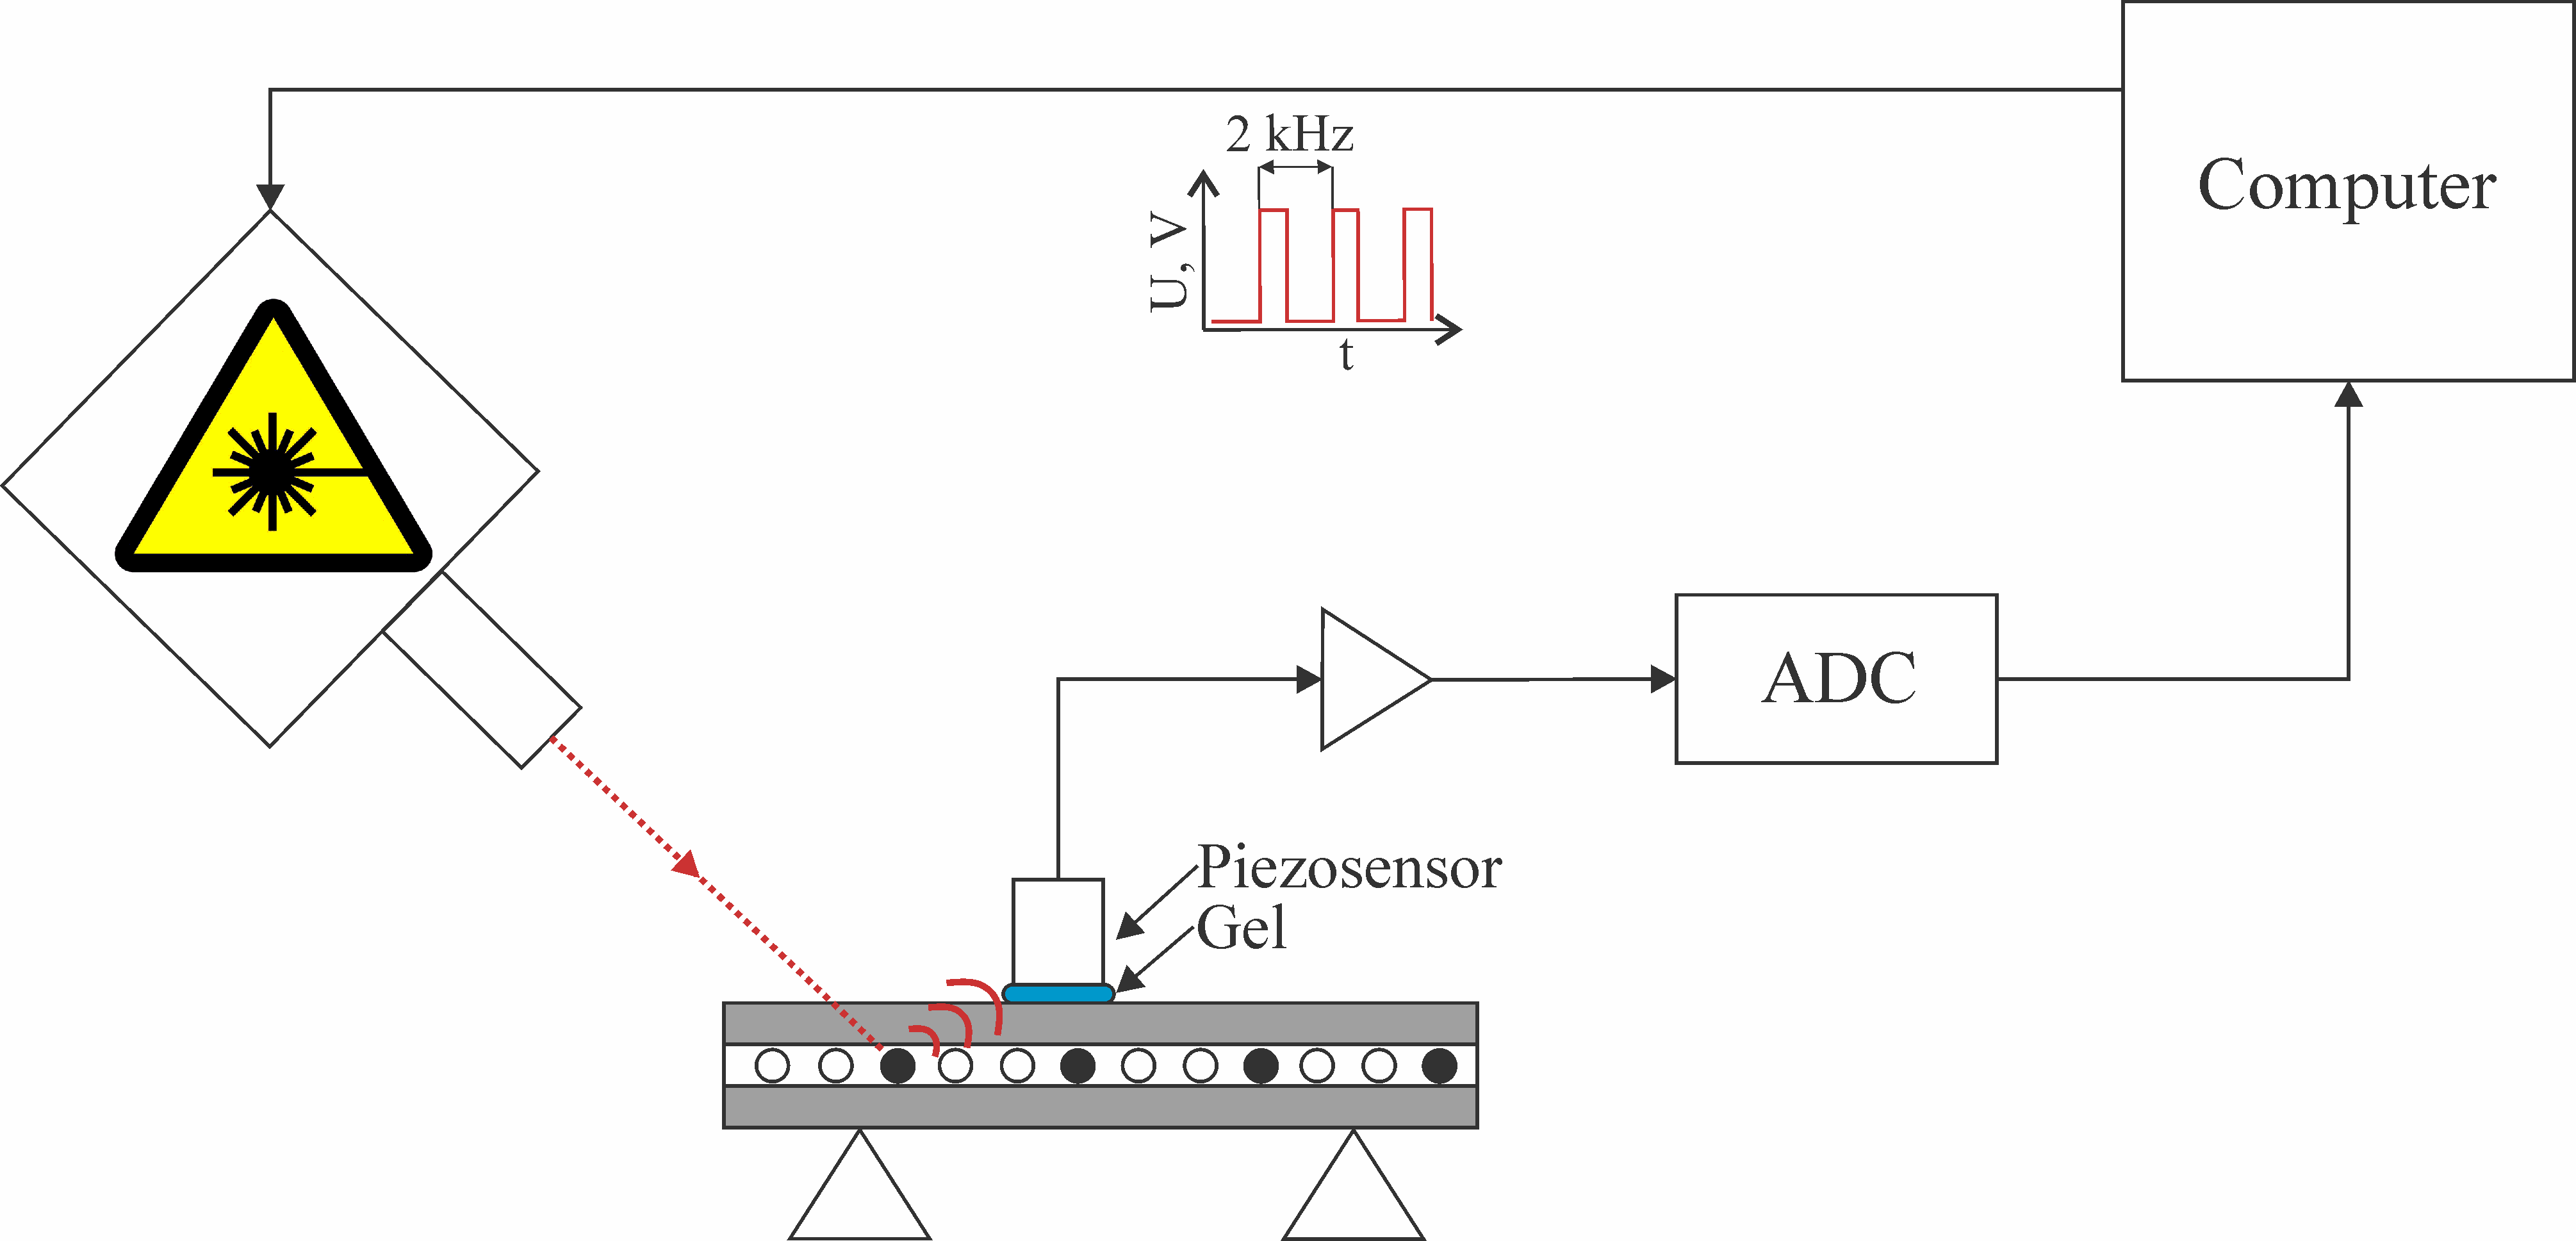
Figure 1. The structure of the photoacoustic setup
The study was conducted using a model of a blood vessel as round polyurethane tube with internal diameter of 100 µm and outer diameter of 300 µm. The acoustic responses were studied in three types of experiments:
· Tube with human blood,
· Tube with a solution of the B16F10 [12] mouse melanoma cells in 10 mol/L concentration,
· Control experiments, in which the laser was blocked by an opaque film, and obtained acoustic responses contained no cancer relevant information.
For each type of experiments, we obtained 1000 different waveforms. Melanoma waveforms have greater amplitudes, and currently adopted technique of their automated detection is based on calculation of amplitudes of the waveforms.
We used furrier spectra analysis (Welch’s method [13]) to find the spectral ranges that contain valuable diagnostic information and to propose a reasonable algorithm of pre-analysis involving data filtering. To estimate the effectiveness of the proposed technique we calculated the signal-to-noise ratio in filtered and not filtered data and ratios between amplitudes of melanoma and human blood waveforms. To calculate the signal-to-noise ratios we divided the amplitude of the blood or melanoma waveform by the power of the waveforms from the control experiments. To verify the statistical significance of the results parameters of the distributions (mean ± standard deviation) of the ratios were estimated and compared for each case.
Results
Typical waveforms for each test object are presented in Figure 2. The vertical line on Figure 2 marks the moment of the laser pulse. From Figures 2a and 2b it is evident that the main power of the acoustic response can be observed some time after the laser pulse. Average time delay between the laser and the response was 3.8±0.3 µs (mean ± standard deviation).
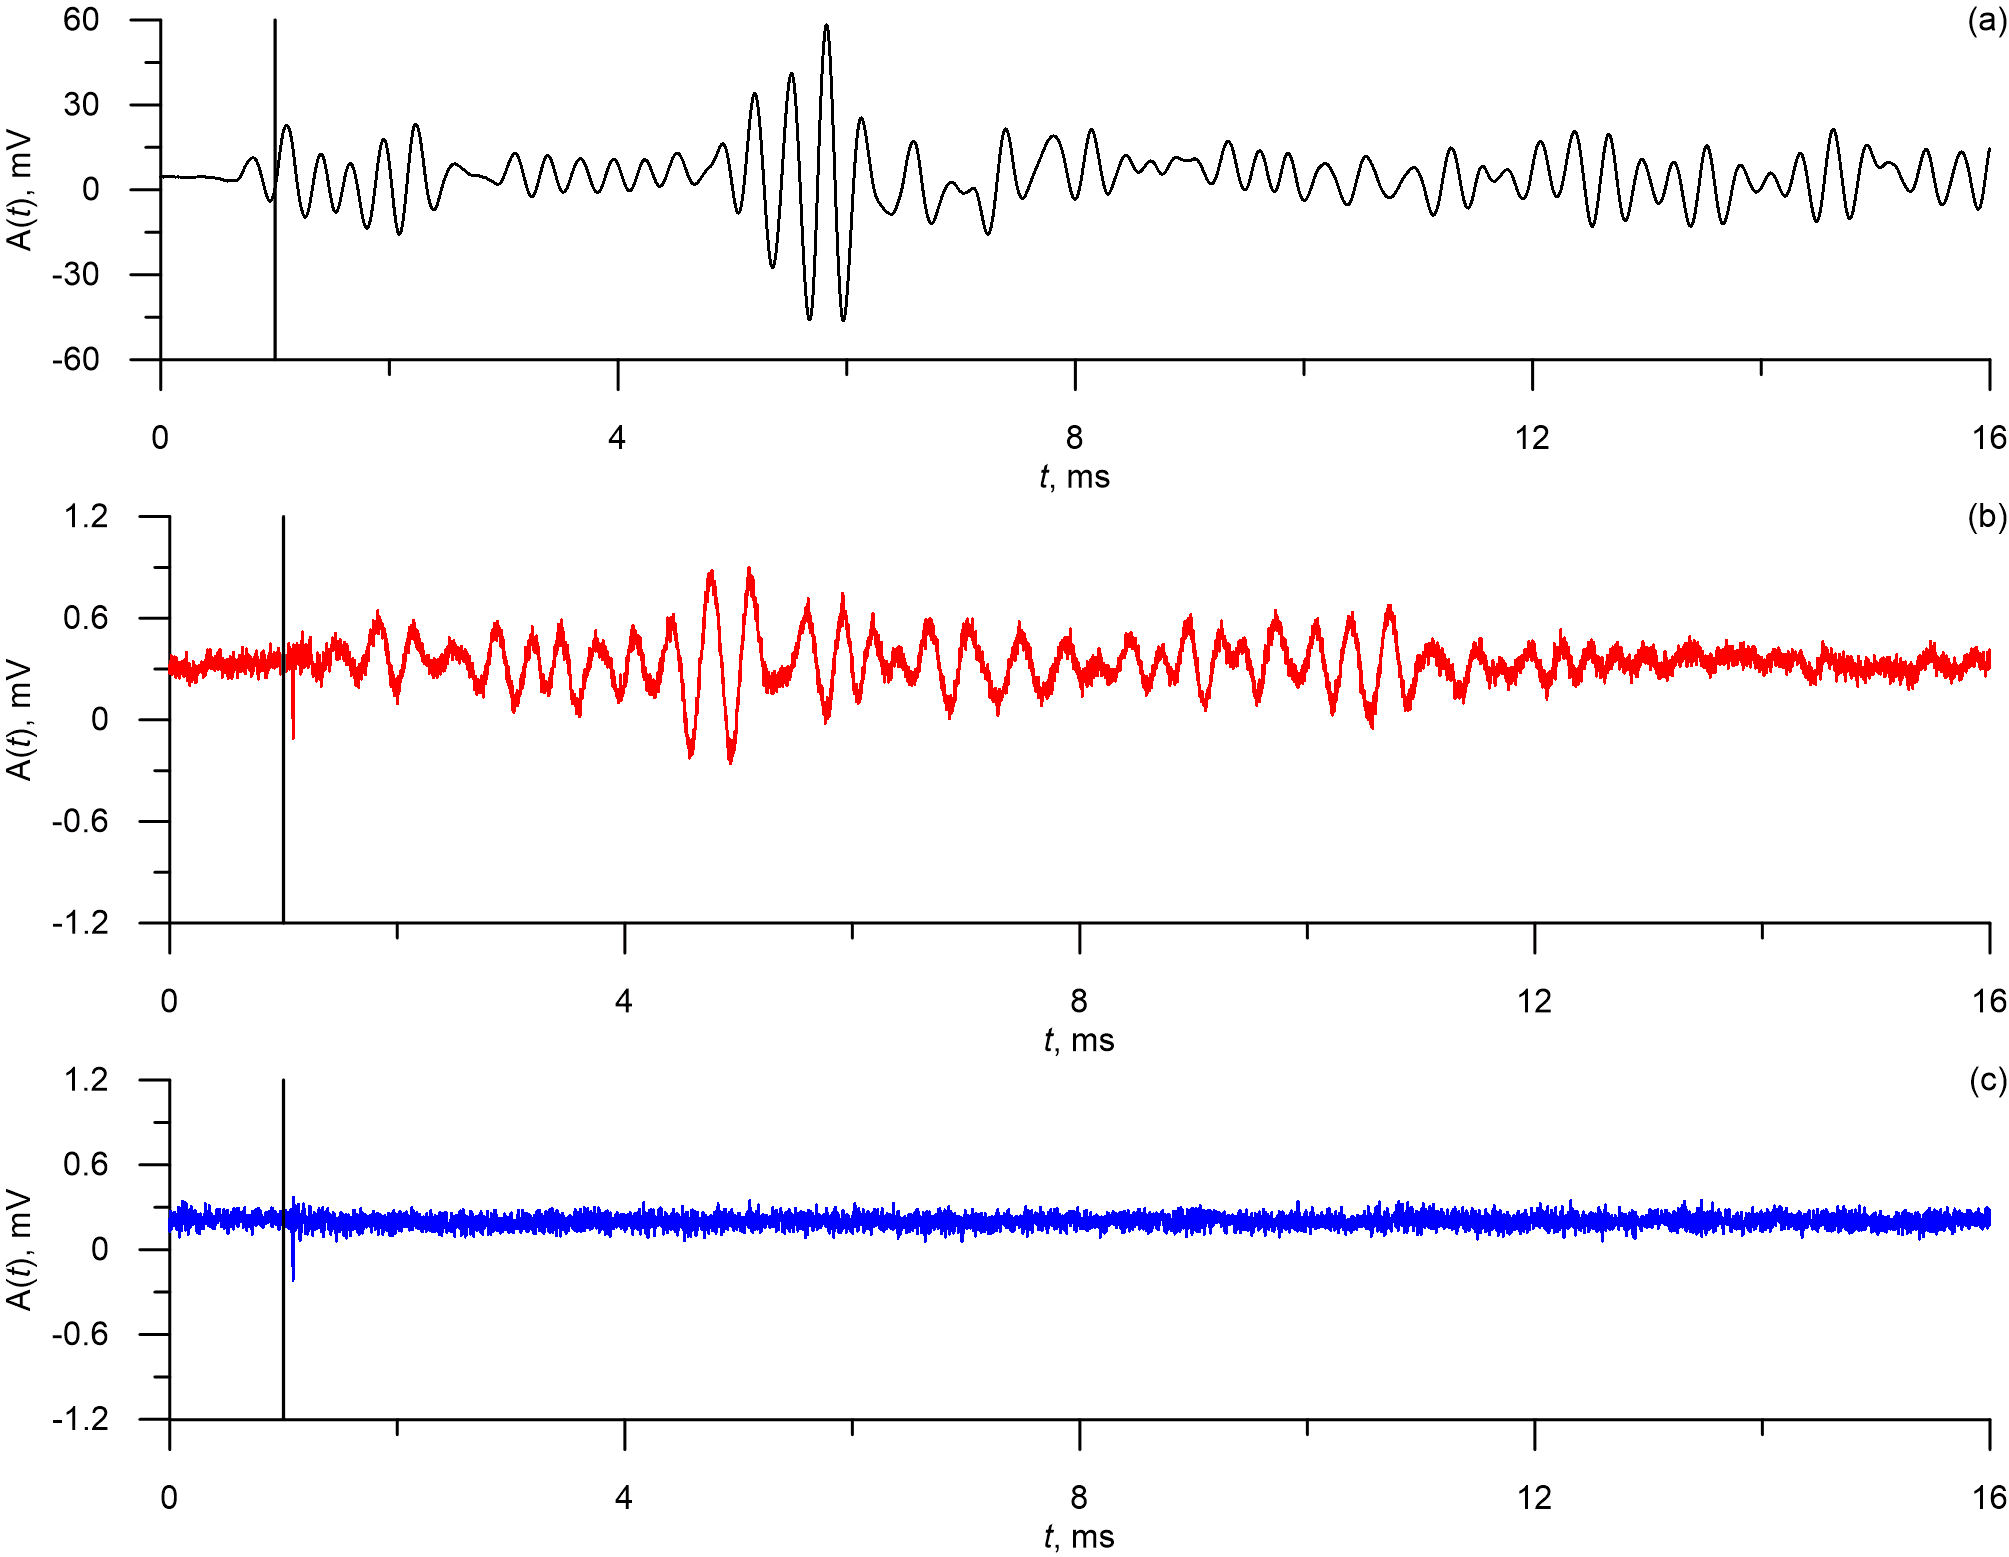
Figure 2. Waveforms from B16F10 melanoma (a), human blood cells (b) and from the photoacoustic platform with blocked laser (c). The signals were obtained using unfocused ultrasound transdicer.
From Figures 2a and 2b it is evident that the laser pulses induce the acoustic responses in the test objects which in turn lead to excitement of oscillations in the unfocused ultrasound transducers. The oscillations have pronounced periodic nature and are not present in the waveforms from the tests with blocked laser. It can also be seen that the amplitude of B16F10 responses (Figure 2a) is significantly larger than the amplitude of the human blood responses (Figure 2b).
Average peak-to-peak amplitudes of oscillations in acoustic responses are 58.21±28.34 mV (mean ± standard deviation) for B16F10 melanoma cells, 2.88±0.19 mV for the human blood cells, and 2.76±0.19 mV for the blocked laser. Therefore signal-to -noise ratio is 21.14±10.39 for the B16F10 melanoma cells and 1.04±0.1 for the human blood cells, which means that for the unfiltered data normal blood waveforms can’t be reliably distinguished from control signals. Average ratio between amplitudes of the melanoma waveforms and normal blood waveforms is 20.34±10.01.
To propose adequate filtering techniques for the pre-analysis of the waveforms we conducted their spectral analysis. Typical power spectra are presented in Figure 3.
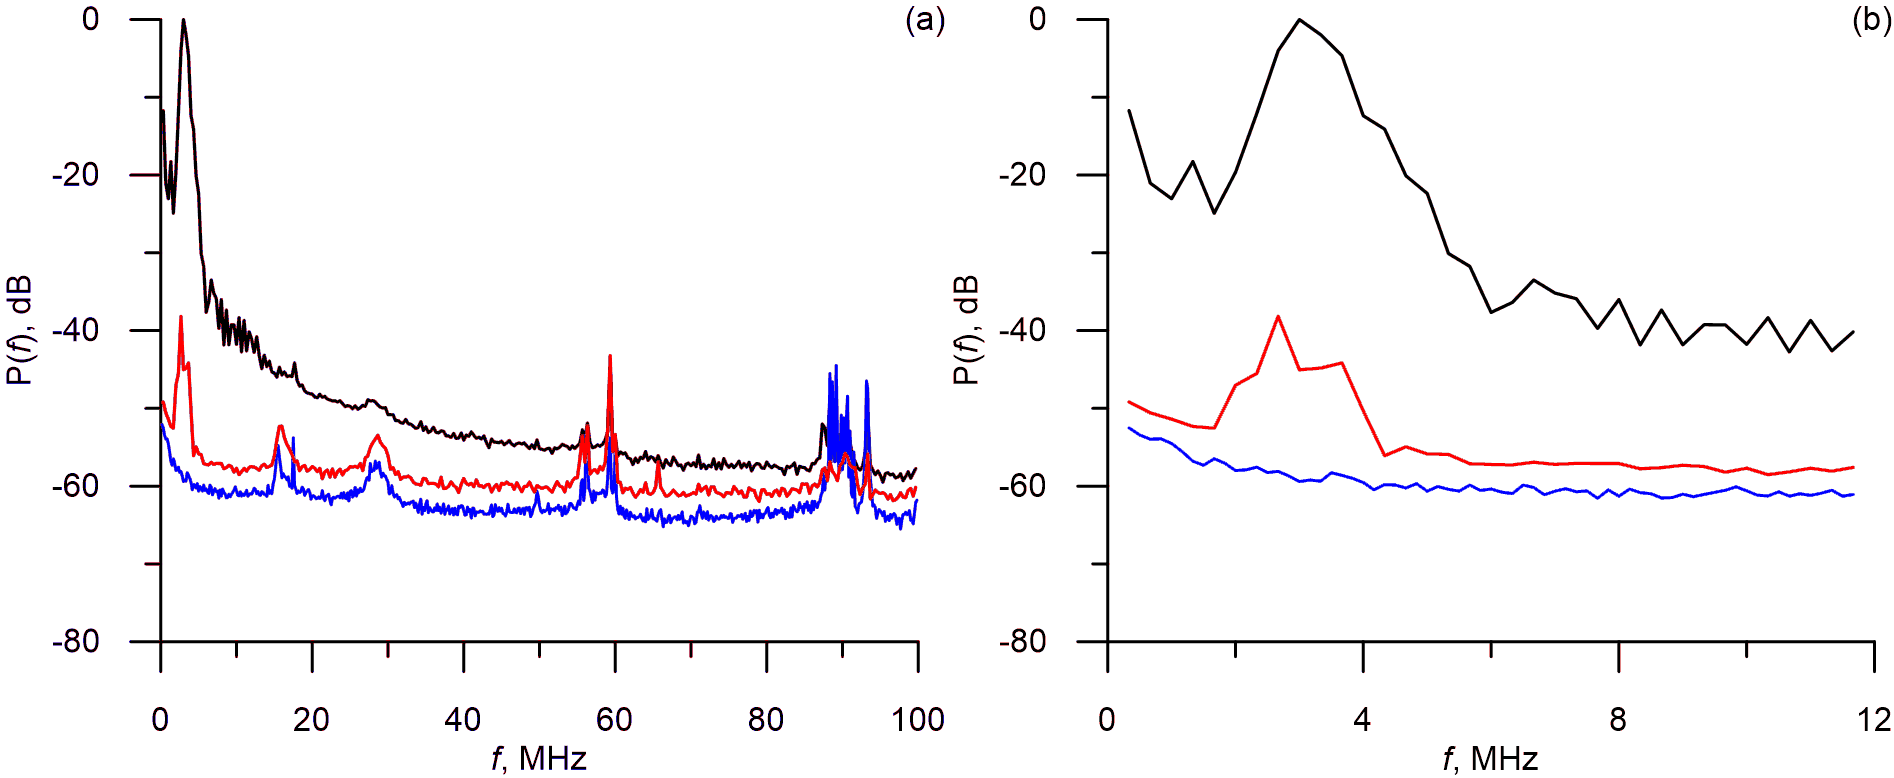
Figure 3. Power spectra of the acoustic responses from human blood cells (red line), B16F10 melanoma cells (black line) and blocked laser (blue line).
After we compared the responses from the human blood cells and the responses obtained with the blocked laser (Figure 3) we concluded that the main power of the response is within 0-6 MHz band (at 3dB level) and the higher harmonics can be observed at frequencies of up to 12 MHz.
From Figure 3 it is evident that the acoustic signals have complicated spectra, however all spectral components with frequency over 12 MHz seem to reflect the disturbances and noises and also have power of less than -40 dB.
The results suggest that it might be viable to filter the data during the pre-analysis. We used the 8th order low-pass Butterwort filter with 12 MHz cut-off frequency.
The average amplitudes of the acoustic responses after the filtration are 57.70±28.81 mV (mean ± standard deviation) for the B16F10 melanoma cells, 1.25±0.19 mV for the human blood cells and 0.51±0.04 mV for the responses obtained with the blocked laser. Filtration resulted in far better signal-to-noise ratio: 110.81±56.94 for the B16F10 melanoma cells and 2.23±0.33 for the human blood cells. Average ratio between amplitudes of the melanoma waveforms and normal blood waveforms is 21.14±10.39. After the filtration all three types of signals can be reliably separated using the calculation of amplitudes of the waveforms.
Discussion
It can be argued that for the waveforms obtained from the model polyurethane vessel there is no need for the pre-analysis filtration, since melanoma waveforms already have far greater amplitudes than the other signals. However, we expect worse signal-to-noise ratio in real humans and test animals, since skin and other tissues will dissipate the laser and weaken the acoustic response. Moreover, the waveforms have acoustic nature and the acoustic sensor is very sensitive to external noises.
Another point of discussion is optical methods of in vivo flow cytometry [14-18]. This field is growing rapidly and reached sensitivity of 1 circulating cell per mL of blood [14]. Optical methods have a significant advantage over our photoacoustic approach, since they can detect the circulating cells that are light in color and, therefore, are not limited to the melanoma cells, but those cells must be marked by fluorescence solutions [15]. Optical in vivo flow cytometry is viable and perspective approach for monitoring of cancer development in already diagnosed patient, since fluorescence solution can be injected in the tumor, and all future metastatic cells would be marked as a result. However, such approach is not visible so far for early diagnostics.
The observed waveforms (Figure 2) demonstrate significant time delay between the laser impulses and the main acoustic response. Such delay was noted earlier in [2] and is caused by finite travel speed of the acoustic response between the cell and the sensor and inertial properties of the cells that affect the thermal expansion.
From the results of the spectral analysis we concluded that the useful part of the spectra is limited to the 0-12 MHz (Figure 3) band with the main frequency of the response being 3 MHz. Higher harmonics are fast to diminish due to the resonance properties of the sensor.
From the spectra it is also evident than waveforms have complex spectral structure. Spectral peaks can be observed at 15 MHz, 30 MHz, 60 MHz, 90 MHz and are present both in the waveforms from the test objects and in the waveforms which were obtained in the experiments with the closed laser. The results suggest that these peaks are caused by disturbances and noises of various origins, including those which originate in the photoacoustic platform itself. Therefore it seems practical to direct the further advancements of the platform towards reducing the >15MHz noises.
Currently the detection of the melanoma is based on calculation of the peak-to-peak amplitude of the acoustic responses. Application of low-pass filter with 12 MHz cut-off frequency during the waveform preprocessing stage resulted in significantly increased sensitivity of the detection.
Some limitation for this study was associated with a model of blood vessel used as the round polyurethane tube. Under such conditions we could not study any effects related to laser dissipation in skin or other tissues, which will occur in real humans and animal model. We also used B16F10 mouse melanoma cells, which are widely used as a model of animal cancer cells, but are not real human cells.
Conclusion
The spectral analysis of the acoustic waveforms demonstrated that relevant diagnostics information is limited to the 0-12 MHz frequency band. The main power of the response was observed around 3 MHz which is the resonance frequency of the unfocused sensor.
On the basis of the obtained results we proposed the algorithm of data filtration that increased the average signal-to-noise ration in the human blood cells acoustic waveforms by a factor of 2.5 and by a factor of 5.4 in the waveforms from B16F10 melanoma cells.
Ethical approval
This article does not contain any studies with human participants or animals performed by any of the authors.
Acknowledgments
This work was supported by the Government of the Russian Federation (grant no. 14.Z50.31.0044 to support scientific research projects implemented at Russian institutions and Russian institutions of higher education), President program for leading scientific school support, grant no. NSh-2594.2020.2, and RFBR, project number 19-32-90206.
Conflict of interest
Dr. Vladimir Zharov and UAMS have a financial interest in the Technology discussed in this presentation/publication. Dr. Vladimir Zharov has a financial interest in CytoAstra, LLC, which has licensed the Technology. These financial interests have been reviewed and approved in accordance with the UAMS conflict of interest policies.
The other authors declare that they have no conflict of interest.
- Mocellin S, Hoon D, Ambrosi A, Nitti D, Rossi CR. The prognostic value of circulating tumor cells in patients with melanoma: A systematic review and meta-analysis. Clin Cancer Res 2006; 12(15): 4605-4613. https://doi.org/10.1158/1078-0432.ccr-06-0823.
- Galanzha EI, Menyaev YA, Yadem AC, Sarimollaoglu M, Juratli MA, Nedosekin DA, et al. In vivo liquid biopsy using Cytophone platform for photoacoustic detection of circulating tumor cells in patients with melanoma. Sci Transl Med 2019; 11(496): eaat5857. https://doi.org/10.1126/scitranslmed.aat5857.
- Hong B, Zu Y. Detecting circulating tumor cells: current challenges and new trends. Theranostics 2013; 3(6): 377‐394. https://doi.org/10.7150/thno.5195.
- Gorges TM, Penkalla N, Schalk T, Joosse SA, Riethdorf S, Tucholski J, et al. Enumeration and molecular characterization of tumor cells in lung cancer patients using a novel in vivo device for capturing circulating tumor cells. Clin Cancer Res 2016; 22(9): 2197-206. https://doi.org/10.1158/1078-0432.ccr-15-1416.
- Khorana AA, Francis CW, Culakova E, Kuderer NM, Lyman GH. Thromboembolism is a leading cause of death in cancer patients receiving outpatient chemotherapy. J Thromb Haemost 2007; 5(3): 632‐634. https://doi.org/10.1111/j.1538-7836.2007.02374.x.
- Sparsa A, Durox H, Doffoel-Hantz V, Munyangango EM, Bédane C, Cendras J, et al. High prevalence and risk factors of thromboembolism in stage IV melanoma. J Eur Acad Dermatol Venereol 2011; 25(3): 340-344. https://doi.org/10.1111/j.1468-3083.2010.03795.x.
- Uchino K. The balance of risk of bleeding and thrombosis in melanoma patients with brain metastases. Melanoma Res 2013; 23(1): 82. https://doi.org/10.1097/cmr.0b013e32835bc415.
- Zharov VP, Letokhov VS. Laser Optoacoustic Spectroscopy Springer-Verlag Berlin Heidelberg, 1986: 329 p. https://doi.org/10.1007/978-3-540-39492-1.
- Stoffels I, Morscher S, Helfrich I, Hillen U, Leyh J, Burton NC, et al. Metastatic status of sentinel lymph nodes in melanoma determined noninvasively with multispectral optoacoustic imaging. Sci Transl Med 2015; 7(317): 317ra199. https://doi.org/10.1126/scitranslmed.aad1278.
- Ermilov SA, Khamapirad T, Conjusteau A, Leonard MH, Lacewell R, Mehta K, et al. Laser optoacoustic imaging system for detection of breast cancer. J Biomed Opt 2009; 14(2): 024007. https://doi.org/10.1117/1.3086616.
- Galanzha EI, Shashkov EV, Spring PM, Suen JY, Zharov VP. In vivo, noninvasive, label-free detection and eradication of circulating metastatic melanoma cells using two-color photoacoustic flow cytometry with a diode laser. Cancer Res 2009; 69(20): 7926‐7934. https://doi.org/10.1158/0008-5472.can-08-4900.
- Fidler IJ. From here to there; a life based on migration. An interview with Isaiah J. Fidler. Int J Dev Biol 2004; 48(5-6): 457‐462. https://doi.org/10.1387/ijdb.041790ih.
- Welch PD. The use of Fast Fourier Transform for the estimation of power spectra: A method based on time averaging over short, modified periodograms. IEEE Trans Audio Electroacoust 1967; 15(2): 70-73. https://doi.org/10.1109/TAU.1967.1161901.
- Tan X, Patil R, Bartosik P, Runnels JM, Lin CP, Niedre M. In Vivo Flow Cytometry of Extremely Rare Circulating Cells. Sci Rep 2019; 9(1): 3366. https://doi.org/10.1038/s41598-019-40143-2.
- Patil R, Tan X, Bartosik P, Detappe A, Runnels JM, Ghobrial I, et al. Fluorescence monitoring of rare circulating tumor cell and cluster dissemination in a multiple myeloma xenograft model in vivo. J Biomed Opt 2019; 24(8): 1-11. https://doi.org/10.1117/1.jbo.24.8.085004.
- Pera V, Tan X, Runnels J, Sardesai N, Lin CP, Niedre M. Diffuse fluorescence fiber probe for in vivo detection of circulating cells. J Biomed Opt 2017; 22(3): 37004. https://doi.org/10.1117/1.jbo.22.3.037004.
- Fan ZC, Yan J, Liu GD, Tan XY, Weng XF, Wu WZ, et al. Real-time monitoring of rare circulating hepatocellular carcinoma cells in an orthotopic model by in vivo flow cytometry assesses resection on metastasis. Cancer Res 2012; 72(10): 2683-2691. https://doi.org/10.1158/0008-5472.can-11-3733.
- Georgakoudi I, Solban N, Novak J, Rice WL, Wei X, Hasan T, Lin CP. In vivo flow cytometry: a new method for enumerating circulating cancer cells. Cancer Res 2004; 64(15): 5044-5047. https://doi.org/10.1158/0008-5472.can-04-1058.
Received 15 March 2020, Revised 20 April 2020, Accepted 11 May 2020
© 2020, Ishbulatov Yu.M., Skazkina V.V., Karavaev A.S., Inozemtseva O.A., Bratashov D.N., Abdurashitov A.S., Grishin O.V., Hramkov A.N., Zharov V.P.
© 2020, Russian Open Medical Journal
Correspondence to to Yurii M. Ishbulatov. Address: Research Institute of Cardiology, Saratov State Medical University, 112, Bolshaya Kazachya str., Saratov, 410012, Russia. E-mail: ishbulatov95@mail.ru.