Introduction
The challenge posed to the world by the COronaVIrus Disease 2019 (COVID-19) pandemic has forced researchers to look into early diagnostics of viral diseases. Development of the methods for early non-invasive screening allows for more efficient and selective use of accurate laboratory methods, and timely isolation of sick patients. Such approaches can significantly reduce the burden on laboratories during epidemics and pandemics, and increase effectiveness of anti-epidemic measures.
A promising direction is to monitor autonomic control of blood circulation. Several well-known works revealed that severe acute respiratory syndrome-related coronavirus 2 (SARS-CoV-2) influences the dynamics of the circulatory system by secreting the angiotensin-converting enzyme 2 (ACE2) [1-3]. The cellular entry point for SARS-CoV-2 is ACE2, which is a component of the renin-angiotensin system (RAS) and is involved in regulation of the cardiovascular system (CVS) [1].
The review article by Huijing Xia and Eric Lazartigues provided data on the interaction of ACE2 and the autonomic nervous system. Changes in the volume of ACE2 secretion significantly affect the autonomic control of blood circulation, modulate the work of the sympathetic and parasympathetic loops, cause changes in long-term and short-term control of blood pressure, prevent or causes the development of hypertension [4].
It was also shown that COVID-19 was noticeably more severe in patients with cardiovascular diseases, which may be was due to increased secretion of ACE2 in these patients compared to healthy people [5-6]. On the other hand, in COVID-19 patients with no detected CVS pathologies, secretion of the ACE2 was also increased, which was, presumably, associated with the activity of the SARS-CoV-2 virus [7].
A variety of methods can be used to diagnose the condition of CVS autonomic control including linear approaches based on statistical and spectral analysis of RR-intervals [8-9], as well as nonlinear approaches that consider the components of the CVS as interacting generators of complex-shaped signals [10-12].
Several studies have shown that such methods were promising tools for COVID-19 diagnosis. For example, work [9] investigated the spectral and time-domain indices of RR-intervals, as well as the standard deviation of RR-intervals (SDNN index). In that paper, it was established that decreased activity of sympathetic control and increased activity of parasympathetic control correlated with a worse prognosis of the natural history in patients with COVID-19. The properties of HVR signals change during the early stages of COVID-19, as was proven in [10] by fitting a nonlinear model to each subject, HRV was monitored before and after the first positive test for COVID-19.
Another work has shown a statistically significant difference between healthy subjects and COVID-19patients, by applying the sample entropy to integrated transformed probability signals (heart rate and systolic blood pressure signals), common symbolic dynamics entropy, and copula parameters, however, only the cross-entropy indexes calculated from HRV and systolic pressure signals showed a statistically significant difference between serious and mild cases of COVID-19. This result contributed to the hypothesis that severity of COVID-19 is associated with RAS disorder and encourages further research.
At the same time, no studies reported a detailed analysis of phase dynamics of autonomic control of CVS during COVID-19. As part of our previous work, we paid great attention to the development of methods for studying not only individual activity of the autonomic control loops but also their coupling [11, 12]. The phase analysis of CVS was shown to be a promising tool for clinical practice, in particular, for correcting the therapy in patients with hypertension and after myocardial infarction [13-15]. We showed that the total percentage of phase synchronization index (S index) was a sensitive index of CVS status [16, 17] and was an index for specific pathologies [13-15].
Therefore, this work aims to study the degree of synchronization of the autonomic control loops of circulation in COVID-19 patients.
Material and Methods
Signal recording
Selected COVID-19 patients match the following inclusion criteria: absence of somatic pathologies; laboratory-confirmed case of COVID-19; All subjects involved in the study gave informed consent to medical intervention and processing of their personal data. The study included 32 healthy volunteers (age 17 to 23, 22 women and 10 men) and 32 patients with COVID-19 (age 25 to 68, 14 women and 18 men). All COVID-19 patients had a mild case of the disease and did not require oxygen support.
We carried out simultaneous registration of electrocardiographic (ECG) and photoplethysmographic (PPG) signals (signal of blood filling, recorded using an optical sensor with active backlight and reflected light setup). The signals were recorded using a standard polygraph EEGA-21/26 “Encephalan-131-03” (Medikom MTD Ltd, Taganrog, Russia). The bandpass filter was set to 0.05–100 Hz and the sampling rate was set to 250 Hz at 14-bit resolution. ECG signals were recorded in the I standard lead (differential signal from the wrists of two hands) and PPG signals were recorded from the earlobe [18]. The PPG signals were recorded using a reflected green light sensor (550 nm) [19].
The experimental signals were recorded at rest in a horizontal position. The length of each recording was 20 minutes. Figure 1 shows typical examples of experimental signals.
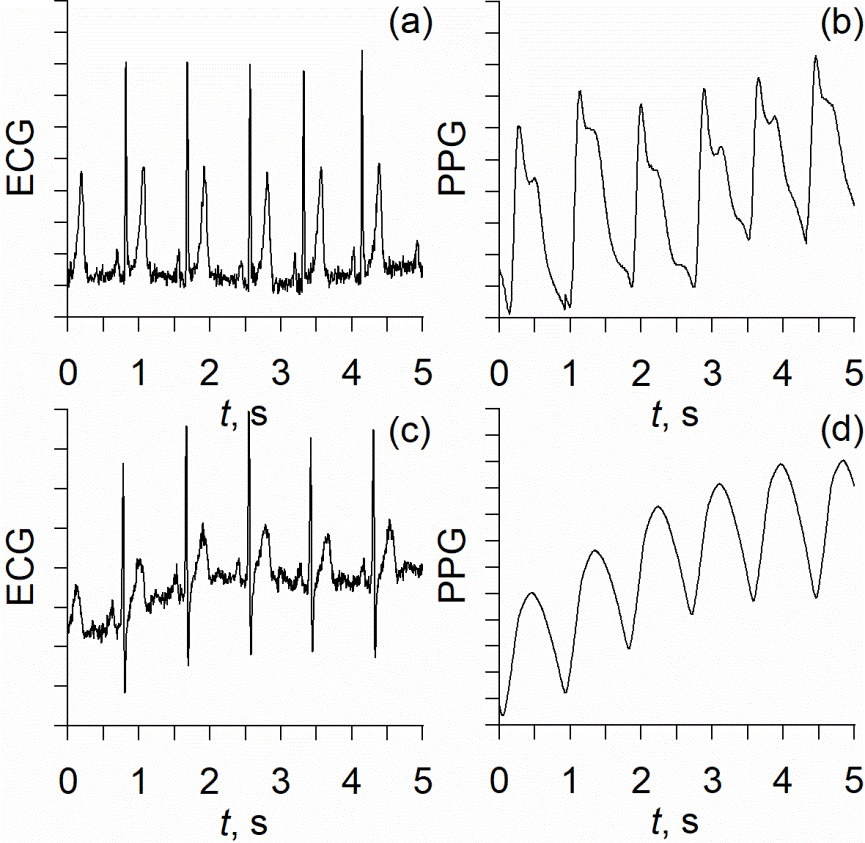
Figure 1. Typical examples of experimental data: (a) – ECG and (b) – PPG from healthy people, (с) – ECG from COVID-19 patients, and (d) – PPG from the COVID-19 patients.
Signal processing
HRV signals were estimated from ECG signals by calculating the sequence of interbeat intervals (RR-intervals). The obtained signals were interpolated using cubic b-splines, as recommended in [8], resulting in equidistant time series of RR-intervals with a sampling frequency of 5 Hz.
As the next step of the signals processing, we detected the intervals of phase synchronization between the LF-oscillations in RR-intervals and PPG signals using a technique proposed in [20]. To introduce a phase of LF-oscillations in the experimental signals, we filtered the experimental signals using a bandpass filter (0.06-0.14 Hz) and obtained the ξ(t) signals. This technique was actively used to study the signals of various nature [21]. The signal ξ(t) was a complex function of time, which is defined as follows:
 (1)
(1)
where s(t) was an HRV or PPG signal, A(t) and φ(t) were, respectively, the amplitude and phase of the analytical signal and the function s̃(t) was the Hilbert transform of s(t),
 (2)
(2)
where P.V. means that the integral was taken in the sense of the Cauchy principal value. Phase φ(t) was then introduced as
 (3)
(3)
Then we calculated the phase difference
 (4)
(4)
where φ1 was the phase of LF-oscillations was the RR-intervals signal and φ2 was the phase of LF-oscillations in the PPG signal.
Linear approximation of the phase difference ∆φ in a moving window was carried out to detect the intervals of phase synchronization. The intervals of ∆φ signal approximated by a close to a horizontal line (which means that |∆φ|<const) were considered to correspond to the intervals of phase synchronization (4).
To quantify the frequency of the synchronous intervals we calculated the total percentage of phase synchronization index (S index). S index is a ratio of the total lengths dk of the intervals of synchronization to the total length T of a signal:
 (5)
(5)
where kis a counting number of a synchronization interval and N is the total number of intervals. The S index represents the relative time that loops of autonomic control exist in the regime of phase synchronization.
Results
The S indices were calculated for healthy volunteers and COVID-19 patients. Individual values of the S indices are shown in Figure 2.
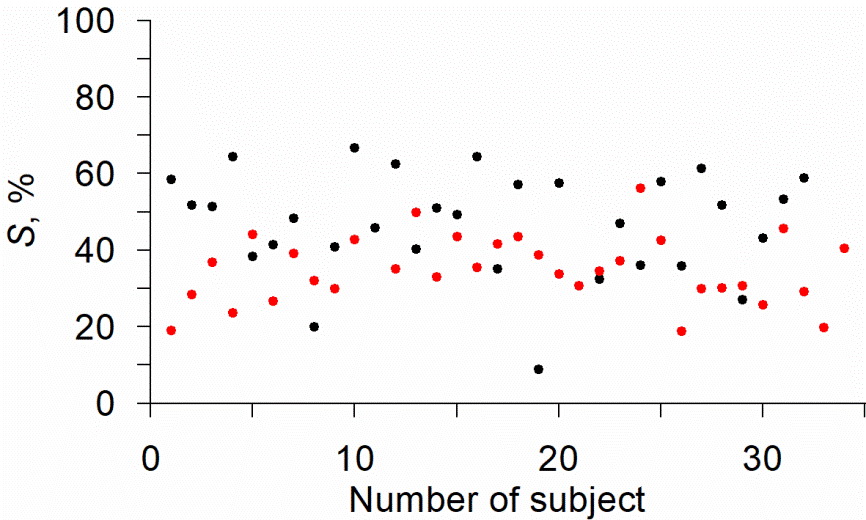
Figure 2. Dot plot of individual values of the S index in healthy volunteers (black) and COVID-19 patients (red).
The maximum value of the S index among the healthy volunteers was 67%, and 56% among the COVID-19 patients; the minimum values of the S index were 9% and 19%, respectively. Fig. 2 shows that the values of the S indices tend to be lower in COVID-19 patients in comparison to the healthy volunteers. The results of the statistical analysis are presented in Figure 3.
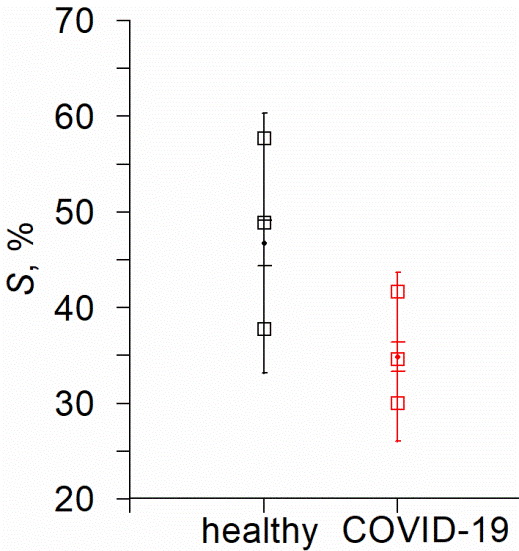
Figure 3. Distribution of the values of the S index estimated for healthy volunteers (black) and COVID-19 patients (red). The points show the mean values, the error bars with wide caps indicate the standard error, the error bars with narrow caps indicate the standard deviation and the open squares are the 3 quartiles.
The results shown in Figure 3 demonstrate that the mean values of the S index in COVID-19 patients are lower in comparison to healthy volunteers. The Mann-Whitney U-test allows us to reveal a significant difference in S values in groups of healthy people and patients: Uemp.=227, U0.05=415.0. The Mann-Whitney U-test confirmed that the difference in the group-average S indices is statistically significant at p≤0.05.
Discussion
The main finding of the study was that the S index, which corresponds to the frequency of phase synchronization intervals between the loops of autonomic control, was lower in COVID-19 patients comparing to healthy volunteers. The Mann-Whitney U-test confirmed that the difference between the group-averaged values of the S index was statistically significant.
We observed the decrease of the S index in COVID-19 patients, despite the known results of other researchers that suggested activation of sympathetic control due to ACE2 expression [4, 6]. It may indicate that the reaction of autonomic control to viral infections is more complex than was previously assumed: the presence of the virus increased the activity of the sympathetic control loops and, at the same time, decreased the strengths of their coupling. This result requires additional research.
The question about the specificity of obtained results is relevant. According to the results from [23], infection by different types of viruses can increase the concentration of ACE2. Additionally, similar effects can be caused by some pathologies affecting RAS (diabetes, kidney disease) [23], some pathologies of the cardiological [5] and gynecological profile [24-25], as well as changes in the physical condition [16], as was shown in our previous studies.
The group-averaged values of the S index were significantly different between the groups of healthy volunteers and COVID-19 patients. However, the sensitivity and specificity of the individual classification was not high (Figure 3). The influence of age and sex on the individual values of the S index requires further careful study. These observations and considerations highlight the limitations of the diagnostics based on the S index.
However, despite these limitations, the S index in combination with other known methods based on spectral analysis of RR intervals [8-9] and nonlinear methods of data analysis [10-12] is a promising basis for a viral diseases screening system. The S index estimates the degree of interaction between the loops of autonomic control, and not their individual dynamics, and, therefore, statistically independent from other well-known indices and, when used in combination with them, provides additional information related to changes in the dynamics of autonomic control of circulation, increasing sensitivity and reliability of the analysis.
Conclusion
Several well-known studies have demonstrated that autonomic control of blood circulation was a sensitive index of a psychophysical state and could be used to detect various pathologies, including viral infections and COVID-19. However, the complexity of autonomic control and the irregular intervals of phase synchronization between the loops of heart rate and arterial pressure control limit the possibilities of the diagnostics indices derived from linear analysis and require the development of specialized nonlinear methods.
In this work, we compared the groups of healthy volunteers and COVID-19 patients using the previously developed index of the total percentage of phase synchronization between the autonomic control loops of CVS.
The obtained results showed that the group-averaged values of the previously proposed index were lower in COVID-19 patients in comparison to healthy volunteers. Statistical analysis of the results was encouraging and suggests that the S index reflected the presence of the viral disease. It makes this index a promising basis for non-invasive screening diagnostics of viral diseases, particularly COVID-19.
Conflict of interest
The authors declare that they have no conflict of interest.
Ethical approval
All procedures performed in the studies involving human participants were in accordance with the ethical standards of the institutional research committee and with the 1964 Helsinki declaration and its later amendments or comparable ethical standards. Design of this study was approved by the Ethics Committee of the Saratov State Medical University n.a. V.I. Razumovsky (Saratov, Russia) in 2021 and written informed consent was obtained from all subjects who participated in this study.
Funding
The reported study was funded by RFBR according to the research project № 20-38-90067.
- Del Rio R, Marcus NJ, Inestrosa NC. Potential Role of Autonomic Dysfunction in Covid-19 Morbidity and Mortality. Front Physiol 2020; 11: 561749. https://doi.org/10.3389/fphys.2020.561749.
- Briguglio M, Porta M, Zuffada F, Bona AR, Crespi T, Pino F, et al. SARS-CoV-2 Aiming for the Heart: A Multicenter Italian Perspective About Cardiovascular Issues in COVID-19. Frontiers in Physiology 2020; 11: 571367. https://doi.org/10.3389/fphys.2020.571367.
- Fudim M, Qadri YJ, Ghadimi K, MacLeod DB, Molinger J, Piccini JP, et al. Implications for Neuromodulation Therapy to Control Inflammation and Related Organ Dysfunction in COVID-19. J Cardiovasc Transl Res 2020; 13(6): 894-899. https://doi.org/10.1007/s12265-020-10031-6.
- Xia H, Lazartigues E. Angiotensin-converting enzyme 2: central regulator for cardiovascular function. Curr Hypertens Rep 2010; 12(3): 170-175. https://doi.org/10.1007/s11906-010-0105-7.
- Zheng YY, Ma YT, Zhang JY, Xie X. COVID-19 and the cardiovascular system. Nat Rev Cardiol 2020; 17(5): 259-260. https://doi.org/10.1038/s41569-020-0360-5.
- Liu Z, Xiao X, Wei X, Li J, Yang J, Tan H, et al. Composition and divergence of coronavirus spike proteins and host ACE2 receptors predict potential intermediate hosts of SARS-CoV-2. J Med Virol 2020; 92(6): 595-601. https://doi.org/10.1002/jmv.25726.
- Silhol F, Sarlon G, Deharo JC, Vaïsse B. Downregulation of ACE2 induces overstimulation of the renin-angiotensin system in COVID-19: should we block the renin-angiotensin system? Hypertens Res 2020; 43: 854–856. https://doi.org/10.1038/s41440-020-0476-3.
- Heart rate variability: Standards of measurement, physiological interpretation and clinical use. Task Force of the European Society of Cardiology and the North American Society of Pacing Electrophysiology. Circulation 1996; 93(5): 1043-1065. https://doi.org/10.1161/01.CIR.93.5.1043.
- Elliott P, Anderson B, Arbustini E, Bilinska Z, Cecchi F, Charron P, et al. Classification of cardiomyopathies: a position statement from the European working group on myocardial and pericardial diseases. Eur Heart J 2008; 29(2): 270-276. https://doi.org/10.1093/eurheartj/ehm342.
- Hirten RP, Danieletto M, Tomalin LK, Choi H, Zweig M, Golden E, et al. Use of Physiological Data From a Wearable Device to Identify SARS-CoV-2 Infection and Symptoms and Predict COVID-19 Diagnosis: Observational Study. J Med Internet Res 2021; 23(2): e26107. https://doi.org/10.2196/26107.
- Karavaev AS, Prokhorov MD, Ponomarenko VI, Kiselev AR, Gridnev VI, Ruban EI, et al. Synchronization of low-frequency oscillations in the human cardiovascular system. Chaos 2009; 19(3): 033112. https://doi.org/10.1063/1.3187794.
- Kiselev AR, Mironov SA, Karavaev AS, Kulminskiy DD, Skazkina VV, Borovkova EI, et al. A comprehensive assessment of cardiovascular autonomic control using photoplethysmograms recorded from the earlobe and fingers. Physiol Meas 2016; 37(4): 580-595. https://doi.org/10.1088/0967-3334/37/4/580.
- Ponomarenko VI, Prokhorov MD, Karavaev AS, Kiselev AR, Gridnev VI, Bezruchko BP. Synchronization of low-frequency oscillations in the cardiovascular system: Application to medical diagnostics and treatment. Eur Phys J Spec Top 2013; 222(10): 2687-2696. https://doi.org/10.1140/epjst/e2013-02048-1.
- Kiselev AR, Gridnev VI, Prokhorov MD, Karavaev AS, Posnenkova OM, Ponomarenko VI, et al. Evaluation of 5-year risk of cardiovascular events in patients after acute myocardial infarction using synchronization of 0.1-Hz rhythms in cardiovascular system. Ann Noninvasive Electrocardiol 2012; 17(3): 204-213. https://doi.org/10.1111/j.1542-474X.2012.00514.x.
- Kiselev AR, Gridnev VI, Karavaev AS, Posnenkova OM, Prokhorov MD, Ponomarenko VI, et al. The dynamics of 0.1 Hz oscillations synchronization in cardiovascular system during the treatment of acute myocardial infarction patients. Applied Med Inform 2011; 28(1): 1-8. https://www.elibrary.ru/item.asp?id=27198101.
- Ishbulatov YM, Karavaev AS, Kiselev AR, Simonyan MA, Prokhorov MD, Ponomarenko VI, et al. Mathematical modeling of the cardiovascular autonomic control in healthy subjects during a passive head-up tilt test. Sci Rep 2020; 10(1): 16525. https://doi.org/10.1038/s41598-020-71532-7.
- Kiselev AR, Borovkova EI, Shvartz VA, Skazkina VV, Karavaev AS, Prokhorov MD, et al. Low-frequency variability in photoplethysmographic waveform and heart rate during on-pump cardiac surgery with or without cardioplegia. Sci Rep 2020; 10(1): 2118. https://doi.org/10.1038/s41598-020-58196-z.
- Allen J. Photoplethysmography and its application in clinical physiological measurement. Physiol Meas 2007; 28(3): R1–R39. https://doi.org/10.1088/0967-3334/28/3/R01.
- Bashkatov A, Genina E, Kochubey V, Tuchin V. Optical properties of human skin, subcutaneous and mucous tissues in the wave-length range from 400 to 2000 nm. J Phys D: Appl Phys 2005; 38(15): 2543-2555. https://doi.org/10.1088/0022-3727/38/15/004.
- Kiselev AR, Karavaev AS, Gridnev VI, Prokhorov MD, Ponomarenko VI, Borovkova EI, et al. Method of estimation of synchronization strength between low-frequency oscillations in heart rate variability and photoplethysmographic waveform variability. Russ Open Med J 2016; 5: e0101. https://doi.org/10.15275/rusomj.2016.0101.
- Rosenblum MG, Pikovsky AS, Kurths J, Schafer C, Tass PA. Phase synchronization: from theory to data analysis. In: Moss F, Gielen S, Hoff AJ, Eds. Handbook of biological physics, Vol. 4, Neuro-informatics. New York: Elsevier Science. 2001: 279-321. https://piccardi.faculty.polimi.it/VarieCsr/Papers/Rosenblum2001.pdf.
- Bian J, Li Z. Angiotensin-converting enzyme 2 (ACE2): SARS-CoV-2 receptor and RAS modulator. Acta Pharm Sin B 2021; 11(1): 1-12. https://doi.org/10.1016/j.apsb.2020.10.006.
- Díaz HS, Toledo C, Andrade DC, Marcus NJ, Del Rio R. Neuroinflammation in heart failure: new insights for an old disease. J Physiol 2020; 598(1): 33-59. https://doi.org/10.1113/JP278864.
- Neufeld IW, Kiselev AR, Karavaev AS, Prokhorov MD, Gridnev VI, Ponomarenko VI, et al. Autonomic control of cardiovascular system in pre- and postmenopausal women: a cross-sectional study. J Turk Ger Gynecol Assoc 2015; 16(1): 11-20. https://doi.org/10.5152/jtgga.2015.15201.
- Navrotskaya EV, Alipov VV, Ishbulatov YuM, Bezruchko BP, Zeulina EE, Kuligin AV, et al. Estimating the influence of spinal block and ataractanalgesia on the coupling between the rhythms of autonomic control of heart rate and vascular tone during gynecological operation. Russ Open Med J 2019; 8(3): e0305. https://doi.org/10.15275/rusomj.2019.0305.
Received 17 March 20221, Revised 21 June 2021, Accepted 19 July 2021
© 2021, Russian Open Medical Journal
Correspondence to Anton Kiselev. Email: kiselev@gnicpm.ru.