Introduction
A new global threat announced by the World Health Organization (WHO) on March 11, 2020, caused by the pandemic spread of a novel coronavirus infection, SARS-CoV-2, has become a tangible concern for wellbeing of the humanity. The COVID-19 disease resulting in atypical severe acute respiratory syndrome (SARS) [1], prone to progression in 20% of infected patients [2] and characterized by high probability of lethal outcome [3], posed a problem to clinicians and epidemiologists all over the world [4]. With a significant variation in case fatality rates (0.3-5.8%) across countries [5], the analysis of the true consequences of the pandemic has become a real challenge to public health officials. After two years of the pandemic, an up-to-date comparison of predicted risks with observed data became available for analysis.
The increased mortality associated with COVID-19 could lead to potential demographic losses. This may be especially important for sparsely populated small urban districts and territories with a population of up to 100,000 people, such as the closed administrative territory (CAT) of the Ozersk Urban District, located 10 km from the Mayak nuclear complex [6] in the South Ural Region of the Russian Federation. The peculiarity of the immune status of the CAT population subjected to occupational exposure to ionizing radiation as a result of employment at the Mayak Production Association [7] makes it necessary to pay more attention to the possible health consequences for the residents of Ozyorsk in the complex interaction of radiation, socioeconomic and behavioral factors, including the impact of a novel coronavirus infection.
A number of studies since the onset of the pandemic [3-5, 8-15] described the impact of the pandemic using specific mortality indicators, such as infection fatality rate (IFR) and case fatality rate (CFR). These widely used measures of infection prevalence are sensitive to certain demographic and socioeconomic conditions, which may vary from country to country. According to the WHO, “... the true rate of transmission is often underestimated because a significant proportion of people with infection are not detected, either because they are asymptomatic or have only mild symptoms” [13]. Thus, the use of specific mortality rates may be compromised by underestimation [11]. On the other hand, the specific mortality rate for patients admitted to a hospital [14] would be higher than among the rest of the infected, and may lead to an overestimation of the consequences of SARS-CoV-2 infection when extrapolated to the entire population [15]. Besides, laboratory-confirmed deaths used to calculate the specific impact of COVID-19 may underestimate mortality, as some deaths remain unidentified [16]. Moreover, mortality rate calculated in different periods of the epidemic process in different countries can vary greatly (0.1-25% or more) [13], which could result in an erroneous comparison of results [8]. Finally, a common limitation of such studies is the inability to distinguish direct and indirect effects of the pandemic on the overall mortality.
In this study, we moved away from the conventional use of specific mortality rates that are sensitive to various calculation methods in order to more broadly look at the problem, which helped to more accurately quantify the detrimental impact of the pandemic.
Material and Methods
Descriptive statistics
A retrospective study was conducted among the population of the Ozyorsk Urban District, which has been providing an uninterrupted production cycle of the Mayak nuclear complex since 1948. The study period covered the decade from 2011 to 2021, including two pandemic years. Based on demographic data from open sources, the potential impact of the pandemic on the overall mortality in Ozyorsk Urban District was analyzed. The source of information was the Department of Municipal Statistics, which annually provided reports containing major demographic parameters, including the population size, mean age of the population, male/female ratio, the total number of deaths and live births, net migration, and others [17]. The mean age of the population was adjusted using the data from Chelyabinsk Regional Department of Statistics. The number of Sars-Cov-2 infected patients who received medical care in the 1st and 2nd years of the pandemic was provided by the Clinical Hospital No. 71. Based on the obtained demographic data, the crude mortality rate (CMR) was calculated using the formula:
 ,
,
where CMR is a crude mortality rate per 1,000 patients, Mt is the total number of deaths from various causes reported at the end of a given year, Px is a mean population size in a given year calculated as:
 ,
,
where Pxt is a population size at the beginning of the calendar year, Px(t+1) is a population size at the end of the calendar year.
Risk modeling
Changes in the overall mortality attributable to the impact of a of a novel coronavirus infection pandemic-related factors constituted the main hypothesis tested in our study. The excess CMR observed in the 1st and 2nd pandemic year was calculated using the additive excess risk model:
 ,
,
where CMR0 is a background crude mortality rate,
CMRcov is an excess crude mortality rate related to COVID-19 pandemic years.
The excess CMR was calculated by fitting a multiple linear regression model [18] assuming the combined effect of several independent risk factors described as potential confounders, such as the age and gender distributions in the population [3, 9, 11, 12], which depends on the number of live births and net migration, and the proportion of older people:
 ,
,
where CMR (sex,age,pop,cov) represents the total excess mortality in the given calendar year,
sex – male/female ratio,
pop – population size,
age – mean age of the population,
cov1,2 – Indicates the 1st and the 2nd pandemic year,
ki – regression coefficбients,
∈ – residuals.
Four different models were compared to assess the mutual influence of several confounding factors. Model A was developed to estimate the combined effect of several known risk factors: gender, age, net migration, and number of live births in the population. In model B, the influence of only two key parameters was tested: the age and gender distributions of the population. Model C was built based on optimal convergence parameters and contained a single confounding covariant (population size). Model D was presented for a rough estimate of the impact of the pandemic, assuming no confounding effects. The models were compared using statistical significance criteria.
Statistical analysis and detriment calculation
The linear regression model was applied using the statistical package Stata 12.0 [19]. A two-tailed p-value was used to test the hypothesis that each coefficient in the model is different from 0. A multicollinearity test (VIF test) was implemented to identify the covariates that did not provide independent information in the regression model. The criterion for deciding to exclude the covariate was a VIF value greater than 5.0 (low to moderate inflation). The results were considered statistically significant at a confidence level of α=95%. For a given probability, p < 0.05, the F statistic was used to test the null hypothesis under the assumption that the mean squares of a given set of normally distributed covariates, having the same standard deviation, were equal. The quality of the fit was tested using the standard deviation of the adjusted R-squared (R2) model. Comparison of nested models was performed using the likelihood ratio test (LRT) [20,21].
Total pandemic-related detriment (PRD), as an absolute excess of overall mortality related to the 1st and 2nd years of the pandemic, was calculated using the estimated excess CMR:
 .
.
Results
Mortality data description
The dynamics of the population changes during the decade can be seen in Figure 1.
The dynamics of population changes in the Ozersk Urban District shows clear linear downward trend, which can be approximated using linear quadratic model (R2 = 0.99) with a comprehensive linear component (R2 = 0.97). Over the analyzed period, mean male/female ratio was relatively constant: 0.89 (95% CI 0.889; 0.896).

Figure 1. Population dynamics during the decade and trend approximation.
The main demographic characteristics, such as population size to the end of the year (P), mean population size (Px), mean age in the population, number of COVID-19 cases, absolute number of deaths per year (Mt), number of COVID-19 deaths, and the crude mortality rate (CMR) per 1,000 people are presented in Table 1.
Table 1. Population and mortality characteristics of Ozersk Urban District, 2010-2021
|
Year |
P |
Px |
Mean age |
Number of Covid-19 cases |
Mt |
COV-19 deaths |
CMR,‰ |
|
2010 |
97,832 |
‒ |
‒ |
‒ |
1,309 |
‒ |
‒ |
|
2011 |
92,335 |
95,084 |
40.89 |
‒ |
1,243 |
‒ |
13.07 |
|
2012 |
91,744 |
92,040 |
41.16 |
‒ |
1,226 |
‒ |
13.32 |
|
2013 |
91,285 |
91,515 |
40.84 |
‒ |
1,181 |
‒ |
12.90 |
|
2014 |
90,567 |
90,926 |
40.98 |
‒ |
1,240 |
‒ |
13.64 |
|
2015 |
90,029 |
90,298 |
41.09 |
‒ |
1,237 |
‒ |
13.70 |
|
2016 |
89,724 |
89,877 |
41.23 |
‒ |
1,279 |
‒ |
14.23 |
|
2017 |
89,545 |
89,635 |
41.35 |
‒ |
1,227 |
‒ |
13.69 |
|
2018 |
89,230 |
89,388 |
41.52 |
‒ |
1,241 |
‒ |
13.88 |
|
2019 |
88,835 |
89,033 |
41.71 |
‒ |
1,197 |
‒ |
13.44 |
|
2020 |
88,399 |
88,617 |
41.83 |
4,558 |
1,430 |
119 |
16.14 |
|
2021 |
87,902 |
88,151 |
41.91 |
7,257 |
1,612 |
233 |
18.29 |
Table 1 demonstrates an increase in the mean age of population, along with reduction of the population size. The increase in COVID-19 cases, absolute number of deaths, and CMR is shown there as well. Compared with the 1st pandemic year, the increase of CMR in 2021 was 1.13 (95% CI 1.06-1.22; p=4.9×10‒4), and the number of COVID-19 cases increased by 59%. The CMR changes by year and approximation of pre-pandemic and pandemic trends are shown in Figure 2.
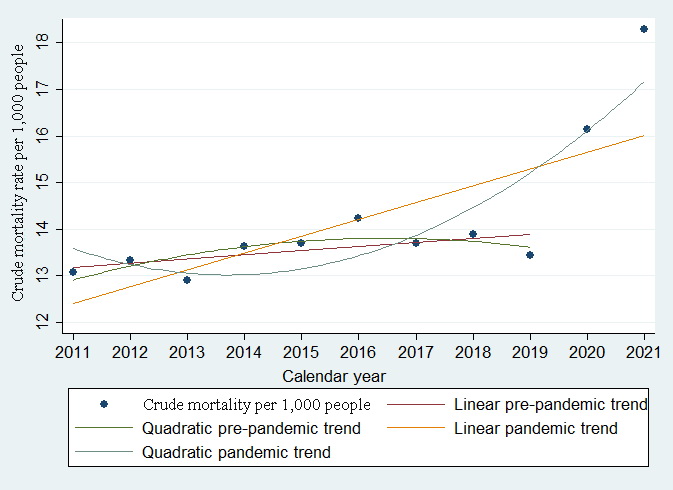
Figure 2. Crude mortality before and after the pandemic approximated with linear and quadratic trends.
Figure 2 shows the reversal of the CMR trend against the downward quadratic pre-pandemic trend reported before 2020. The total mortality growth observed in the period since 2020 has a comprehensive linear component (R2=0.99) against the poor approximation using the quadratic function (R2<0.75).
Model fitting and risk analyses
Model A, with a full set of parameters characterizing demographic change, was fitted to analyze the significance of the effects of age, gender, and population characteristics, such as the number of live births and net migration, on the total CMR. The restricted model (Model B) was fitted to minimize the number of cross-correlated covariates in the model based on the VIF value. An alternative model (C) showed changes in CMR with population size. The baseline model (Model D) characterized the net impact of the pandemic ignoring the age and population size. Comparisons of the fitted models and regression coefficients are presented in Table 2.
Table 2. Comparison of excess CMR models with different sets of parameters
|
Parameter |
Coeff. |
p-value |
CI 95% |
Parameter |
Coeff. |
p-value |
CI 95% |
|
Full model (A) |
Restricted model (B) |
||||||
|
male |
-0.001 |
0.400 |
-0.002; 0.001 |
pop |
-0.0003 |
0.130 |
-0.001; 0.0001 |
|
age |
0.627 |
0.792 |
-5.55; 6.81 |
age |
-0.395 |
0.607 |
-2.18; 1.39 |
|
mig |
0.001 |
0.435 |
-0.002; 0.004 |
- |
- |
- |
- |
|
birth |
0.003 |
0.509 |
-0.009; 0.015 |
- |
- |
- |
- |
|
cov1 |
2.35 |
0.011 |
0.89; 3.81 |
cov1 |
2.23 |
0.002 |
1.15; 3.32 |
|
cov2 |
4.17 |
0.002 |
7.67; 5.68 |
cov2 |
4.26 |
<1×10‒4 |
3.13; 5.40 |
|
const |
4.96 |
0.966 |
-297.5; 307.39 |
const |
57.78 |
0.238 |
-50.15; 165.7 |
|
F (6, 4) = 27.45; F=0.0033 Adj R-squared=0.9407 S.D.=0.39; mean VIF=17.3 |
F (4, 6)=54.62; F=0.0001 Adj R-squared=0.9555 S.D.=0.34; mean VIF=3.8 |
||||||
|
Restricted model (C) |
Simple regression, baseline model (D) |
||||||
|
pop |
-0.0002 |
0.045 |
-0.0005; -0.00001 |
- |
- |
- |
- |
|
cov1 |
2.14 |
0.001 |
1.23; 3.05 |
cov1 |
2.59 |
<1×10‒4 |
1.60; 3.59 |
|
cov2 |
4.18 |
<1×10‒4 |
3.21; 5.15 |
cov2 |
4.74 |
<1×10‒4 |
3.75; 5.74 |
|
const |
34.37 |
0.005 |
14.16; 54.59 |
const |
13.54 |
<1×10‒4 |
13,23; 13.86 |
|
F (3, 7) = 80.89; F<0.0001 Adj R-squared=0.9599 S.D.=0.32; mean VIF=1.17 |
F (2, 8)=73.18; F<0.0001 Adj R-squared=0.9352 S.D.=0.41; mean VIF=1.01 |
||||||
As seen in Table 2, model A demonstrated insignificant effect of the gender, age, net migration, and live births, accompanied by high multicollinearity (VIF 17.3) of added covariates. To reduce variance inflation, the model A was further constrained, resulting in models B, C, and D regarding the significance of covariates (p). An alternative model (Model C) based on one parameter (population size) exhibited good convergence (less than 4% of the total variance could not be explained by this model), lower variance inflation (VIF=1.17), and the lowest standard deviation (0.32).
The baseline CMR model disregarding age and population size (Model D) showed an increased standard deviation (0.41), along with a smaller convergence (0.94). Comparison of models fitted with different subsets is shown in Figure 3.

Figure 3. Crude mortality rate per 1,000 people and corresponding fitted values based on full and restricted models.
Total observed mortality (Mt) and total excess mortality, characterizing the pandemic-related detriment (PRD) calculated based on the excess CMR (excCMR), are presented in Table 3.
Table 3. CMR, excess CMR and PRD in the first two pandemic years (2020-2021) in Ozersk Urban District
|
Year |
Mt |
CMR |
Number of infected |
Fatal* |
excCMR |
PRD |
|
Observed |
COVID-19 |
Model C |
||||
|
2020 |
1,430 |
16.14 |
4,558 |
119 |
2.14 |
189.7 |
|
2021 |
1,612 |
18.29 |
7,257 |
233 |
4.18 |
368.2 |
|
Total |
3,042 |
- |
11,815 |
352 |
- |
557.9 |
The predicted population-adjusted PRD was 189.7 excess deaths in 2020 and 368.2 excess deaths in 2021, respectively. The total two-year PRD was estimated at 557.9 cases (18.3% of total all-cause deaths over the two-year pandemic period). The predicted total excess mortality per 1,000 population-adjusted cases of COVID-19 was 55.2 (95% CI 42.5; 68.0). According to specific mortality data provided by Clinical Hospital 71 (Table 1), the difference between the observed numbers of COVID-related deaths in 2020 and 2021 and the predicted excess mortality from all causes calculated in the model (70.7 and 135.2 cases, 37%) implied a significant indirect impact of the pandemic.
Discussion
The uncertainty of this study depends on the predictive value of the used model, which varies depending on the number of included parameters (Figure 3). The multicomponent model (Model A) was compromised by high variance inflation due to cross-correlation. No significant effects of gender, mean age in the population, net migration and number of live births on total mortality has been found, in contrast to the strong impact of the presence of pandemic.
The use of the truncated model led to a decrease in the variance inflation and improved convergence. Inclusion of the age covariate (p>0.5) resulted in a slightly better approximation of model B, compared with the baseline model. However, the null hypothesis that the mean age in the population did not directly affect the number of total deaths could not be rejected at a confidence level of 95%, which demonstrated a weak confounding effect, as compared to the reported individual effects of age [11]. This happens when time-dependent interrelated factors that cannot be described in the current dataset work together and therefore cannot be separated within an additive model (for example, when they act in different directions, confounding each other). This leads to a decrease in the significance of the general covariate. Obviously, age per se, as the difference between the year of birth and the current calendar year, does not possess its own pathogenetic meaning, but rather can serve as a ‘depot’ variable containing information about several hidden interrelated time-dependent factors.
In this study, we found 190 population-adjusted excess deaths in 2020, which was consistent with our previous study [22]. Our new findings suggested that the negative factor that affected the population at the beginning of 2020 was not eliminated and led to 368 new excess deaths during 2021, with an almost twofold increase in the number of COVID-19 cases (Table 1). At the same time, about 37% of excess cases during each pandemic year were not associated with COVID-19 (Table 3), implying a significant indirect impact of the pandemic.
Based on the total number of observed deaths from COVID-19, the two-year IFR in COVID-19 infected people in the Ozyorsk Urban District was 2.98%, which was slightly lower compared to the entire Chelyabinsk Region (3.66%) [23]. It should be noted that the number of COVID-19 deaths registered in the Ozyorsk Urban District from January 1 through July 31, 2022 (7 months) was 65, which may indicate a further decrease in specific mortality.
In our study we established a significant relationship between the number of diseased with COVID-19, and the overall mortality of the CAT population. Predicted number of deaths per 1,000 population-adjusted cases was 55.2 (95% CI 42.5; 68.0), resulting in 228.8 excess all-cause deaths in 2020 and 364.3 deaths in 2021, respectively. This estimate is 20% higher than obtained in the model above (189.7 cases in 2020) but is in good agreement with 2021 levels. Assuming that the number of COVID-19 cases reported during 2020 was correctly estimated [13], this gives 47.8% of excess non-COVID-19 deaths, which implies the indirect pandemic-related detriment. The latter could be explained in terms of population aging and the impact of other risk factors, such as occupational exposure to ionizing radiation.
The high sensitivity of the elderly population who have chronic diseases and comorbidities [11, 12, 14] calls for special attention to this subgroup in terms of the indirect consequences of COVID-19. Having a higher probability of death during the COVID-19 pandemic [24, 25], elderly residents of a nuclear city may also have higher occupational doses due to their exposure to ionizing radiation as a result of working at a nuclear complex, compared with younger residents. Thus, COVID-related mortality in the elderly population of a nuclear city may be associated with the impact of at least one additional risk factor [26].
Moreover, the radiation exposure of the elderly people during the pandemic years can significantly grow due to CT examinations [27] as the most informative diagnostic method for respiratory disorders related to pandemic. Assuming possible recurrent CT, this leads to an increase in additional radiation exposure burden among the population of a nuclear city subjected to occupational ionizing radiation. Taking into account the peculiarities of the immune status of nuclear workers [28], our findings should be taken into account by radiation protection authorities and epidemiologists assessing radiation-induced cancer mortality among nuclear workers and their descendants [29-33], because the pandemic should be perceived as a competing risk factor potentially confounding cancer mortality as well.
Conclusion
The impact of the COVID-19 pandemic has led to a statistically significant excess of the overall mortality of the nuclear city population both in 2020 and 2021, as compared to the previous non-pandemic decade. A new negative risk factor reversed the mortality trend. Two-year results demonstrated an increase in the absolute number of deaths from all causes against the increase in the number of diseased with novel coronavirus infection. The impact of the COVID-19 pandemic revealed a complex mechanism acting both directly and indirectly. Taking into account the newly gained knowledge, further research is needed to assess the long-term effects of the COVID-19 pandemic. The results obtained in this study are important for adapting the current healthcare system to the contemporary challenges of a pandemic reality.
Acknowledgements
Authors would like to express their appreciation to the Department of Economics of Ozersk District Administration for provided demographic data, and personally to the head of the department, Dr. Aleksandr Zhmaylo, for discussing the study results, and to Anna Dokukina, Head of the Department of Municipal Statistics, for data processing. Special thanks to Eduard Budushchev, Chief Environmental Health Official of Ozersk District, and Larisa Babkina, Lead Epidemiologist of Ozersk District, for the discussion. Authors are grateful to Dr. Sergey Romanov, Director of Southern Ural Institute of Biophysics, for the coordination.
Ethical approval
This article does not involve any studies with human participants or animals performed by any of the authors.
Conflict of interest
Authors declare no conflicts of interest.
Funding
The research received no external funding.
- Lotfi M, Hamblin MR, Rezaei N. COVID-19: Transmission, prevention, and potential therapeutic opportunities. Clin Chim Acta 2020; 508: 254-266. https://doi.org/10.1016/j.cca.2020.05.044.
- Müller O, Neuhann F, Razum O. Epidemiology and control of COVID-19. Dtsch Med Wochenschr 2020; 145(10): 670-674. German. https://doi.org/10.1055/a-1162-1987.
- Modig K, Ahlbom A, Matthews A. COVID-19 – deaths and analysis. Lakartidningen 2020; 117: F3XL. Swedish. https://pubmed.ncbi.nlm.nih.gov/32365212.
- Lai CC, Shih TP, Ko WC, Tang HJ, Hsueh PR. Severe acute respiratory syndrome coronavirus 2 (SARS-CoV-2) and coronavirus disease-2019 (COVID-19): The epidemic and the challenges. Int J Antimicrob Agents 2020; 55(3): 105924. https://doi.org/10.1016/j.ijantimicag.2020.105924.
- Ensheng D, Hongru D, Lauren G. An interactive web-based dashboard to track COVID-19 in real time. Lancet Infect Dis 2020; 20(5): 533-534. https://doi.org/10.1016/s1473-3099(20)30120-1.
- Koshurnikova NA, Shilnikova NS, Okatenko PV, Kreslov VV, Bolotnikova MG, Sokolnikov ME, et al. Characteristics of the cohort of workers at the Mayak nuclear complex. Radiat Res 1999; 152(4): 352-363. https://pubmed.ncbi.nlm.nih.gov/10477912.
- Akiyama M. Late effects of radiation on the human immune system: An overview of immune response among the atomic bomb survivors. Int J Radiat Biol 1995; 68(5): 497-508. https://doi.org/10.1080/09553009514551491.
- Drapkina OM, Samorodskaya IV, Sivtseva MG, Kakorina EP, Briko NI, Cherkasov SN, et al. Methodological aspects of assessing the incidence, prevalence, case fatality and mortality in COVID-19. Cardiovascular Therapy and Prevention 2020; 19(3): 302-309. Russian. https://doi.org/10.15829/1728-8800-2020-2585.
- Weiss P, Murdoch DR. Clinical course and mortality risk of severe COVID-19. Lancet 2020; 395(10229): 1014-1015. https://doi.org/10.1016/s0140-6736(20)30633-4.
- Druzhinin PV, Molchanova EV. Mortality of the population of Russian regions in the context of the COVID-19 pandemic. Regionology 2021; 29(3): 666-685. Russian. https://doi.org/10.15507/2413-1407.116.029.202103.666-685.
- Fazekas-Pongor V, Szarvas Z, Nagy ND, Péterfi A, Ungvári Z, Horváth VJ, et al. Different patterns of excess all-cause mortality by age and sex in Hungary during the 2nd and 3rd waves of the COVID-19 pandemic. Geroscience 2022; 44(5): 2361-2369. https://doi.org/10.1007/s11357-022-00622-3.
- Vidaurre T, Enriquez-Vera D, Bertani S. Excess mortality in patients with cancer during the COVID-19 pandemic in Peru: An analysis of death registry data. The Lancet. Oncology 2022; 23: S28. https://doi.org/10.1016/S1470-2045(22)00427-2.
- World Health Organization. Estimating mortality from COVID-19. 2020. https://www.who.int/news-room/commentaries/detail/estimating-mortality-from-covid-19.
- Richardson S, Hirsch JS, Narasimhan M, Crawford JM, McGinn T, Davidson KW, et al. Presenting characteristics, comorbidities, and outcomes among 5700 patients hospitalized with COVID-19 in the New York City Area. JAMA 2020; 323(20): 2052-2059. https://doi.org/10.1001/jama.2020.6775.
- Grasselli G, Zangrillo A, Zanella A, Antonelli M, Cabrini L, Castelli A, et al. COVID-19 Lombardy ICU Network. Baseline characteristics and outcomes of 1,591 patients infected with SARS-CoV-2 admitted to ICUs of the Lombardy Region, Italy. JAMA 2020; 323(16): 1574-1581. https://doi.org/10.1001/jama.2020.5394.
- Li C, Zhao C, Bao J, Tang B, Wang Y, Gu B. Laboratory diagnosis of coronavirus disease-2019 (COVID-19). Clin Chim Acta 2020; 510: 35-46. https://doi.org/10.1016/j.cca.2020.06.045.
- Statistical indicators of socio-economic development of the Ozersky urban district. Russian. http://ozerskadm.ru/regulatory/passport.
- Lin Y, Cheung SH, Poon WY, Lu TY. Pairwise comparisons with ordered categorical data. Stat Med 2013; 32(18): 3192-3205. https://doi.org/10.1002/sim.5751.
- Boston RC, Sumner AE. STATA: A statistical analysis system for examining biomedical data. Adv Exp Med Biol 2003; 537: 353-369. https://doi.org/10.1007/978-1-4419-9019-8_23.
- Schneider A, Hommel G, Blettner M. Linear regression analysis: Part 14 of a series on evaluation of scientific publications. Dtsch Arztebl Int 2010; 107(44): 776-782. https://doi.org/10.3238/arztebl.2010.0776.
- Ma S, Kosorok MR, Fine JP. Additive risk models for survival data with high-dimensional covariates. Biometrics 2006; 62(1), 202-210. https://doi.org/10.1111/j.1541-0420.2005.00405.x.
- Osipov MV, Sokolova VA, Kushnir AS. Evaluation of the impact of COVID-19 pandemic on overall mortality in Ozersk Urban District. Extreme Medicine 2022; (2): 67-62. https://doi.org/10.47183/mes.2022.011.
- Statistics of the spread of coronavirus in the Chelyabinsk region. Russian https://coronavirus-monitor.info/country/russia/chelyabinskaya-oblast.
- Czeisler MÉ, Marynak K, Clark KE, Salah Z, Shakya I, Thierry JM, et al. Delay or avoidance of medical care because of COVID-19–related concerns – United States, June 2020. MMWR Morb Mortal Wkly Rep 2020; 69(36): 1250-1257. https://doi.org/10.15585/mmwr.mm6936a4.
- Guan WJ, Liang WH, Zhao Y, Liang HR, Chen ZS, Li YM, et al. China Medical Treatment Expert Group for COVID-19. Comorbidity and its impact on 1,590 patients with COVID-19 in China: A nationwide analysis. Eur Respir J 2020; 55(5): 2000547. https://doi.org/10.1183/13993003.00547-2020.
- Muirhead CR, Goodill AA, Haylock RG, Vokes J, Little MP, Jackson DA, et al. Occupational radiation exposure and mortality: Second analysis of the National Registry for Radiation Workers. J Radiol Prot 1999; 19(1): 3-26. https://doi.org/10.1088/0952-4746/19/1/002.
- Yurdaisik I, Nurili F, Aksoy SH, Agirman AG, Aktan A. Ionizing radiation exposure in patients with COVID-19: More than needed. Radiat Prot Dosimetry 2021; 194(2-3): 135-143. https://doi.org/10.1093/rpd/ncab092.
- Rybkina VL, Bannikova MV, Adamova GV, Dörr H, Scherthan H, Azizova TV. Immunological markers of chronic occupational radiation exposure. Health Phys 2018; 115(1): 108-113. https://doi.org/10.1097/hp.0000000000000855.
- Finashov LV, Kuznetsova IS, Sokolnikov ME, Skukovsky SG. Radiation risk of prostate cancer incidence due to external gamma-exposure in the cohort of mayak pa workers occupationally subjected to prolonged radiation exposure. Journal of Radiation Safety Issues 2020; (2(98)): 37-48. Russian. https://www.elibrary.ru/item.asp?id=44227950.
- Sosnina SF, Sokolnikov ME. Heritable effects in offspring associated with harmful exposure to parents (Literature review). Radiation Hygiene 2019; 12(3): 84-95. https://doi.org/10.21514/1998-426X-2019-12-3-84-95.
- Shilnikova NS, Preston DL, Ron E, Gilbert ES, Vassilenko EK, Romanov S A, et al. Cancer mortality risk among workers at the Mayak nuclear complex. Radiat Res 2003; 159(6): 787-798. https://doi.org/10.1667/0033-7587(2003)159[0787:cmrawa]2.0.co;2.
- Osipov M, Loginov V, Melnikov V, Shkarednyh V, Druzhinina P. Cancer morbidity and computed tomography: ‘After’ vs. ‘Due to’ challenge. SciMedicine Journal 2021; 3(4): 316-324. https://doi.org/10.28991/SciMedJ-2021-0304-3.
- Osipov M, Sokolnikov M. Previous malignancy as a risk factor for the second solid cancer in a cohort of nuclear workers. SciMedicine Journal 2021; 3(1): 8-15. https://doi.org/10.28991/SciMedJ-2021-0301-2.
Received 23 August 2022, Revised 28 September 2022, Accepted 17 November 2022
© 2022, Russian Open Medical Journal
Correspondence to Mikhail V. Osipov. Phone: +73513076309. E-mail: osipov@subi.su.