Introduction
Allergic diseases (AD) represent an important growing public health problem worldwide [1]. AD results from the interaction between genetic and environmental factors (infectious diseases, exposure to allergens, socioeconomic status of families, and lifestyle) that activate the immune system and produce high levels of immunoglobulin E (IgE) [2]. Accordingly, early identification of the patient with high risk for AD is the first essential step in the early intervention and prevention [3]. It seems that umbilical cord blood total IgE (cIgE) is a product of the fetus and secreted by the 11th week of gestation without cross the placental barrier [4]. A few decades ago, the role of cIgE in predicting the development of AD has been widely discussed. It has been proposed as a valuable tool for identifying neonates with a high risk of developing the AD in future [5-6]. However, there are various studies on the accuracy of cIgE in predicting childhood allergy [7]. The current study aimed to investigate the cIgE of newborns in Lattakia, Syria to specify the predictive value of cIgE in AD during 8 years following up.
Material and Methods
Study population
After approval by the local research ethics committee, children born between January 2007 and February 2015 in the obstetrics department at Tishreen and Al-Assad University Hospitals of Lattakia, Syria were recruited. Exclusion criteria included severe co-morbidity, e.g. congenital defects, perinatal trauma, intracranial hemorrhage, other life-threatening conditions in the perinatal period neonates. Informed written parental consent was obtained for all participants. Blood samples from the umbilical cord were obtained from the infants to measure cIgE.
Questionnaire and examination
A self-administered questionnaire was distributed to the study participants and was completed by them. Data was collected by recording the following information: demographic information (gender, gestational age, birth weight, number of previous pregnancies, mode and season of delivery, smoking during pregnancy, etc..), and family history of allergy (asthma, allergic rhinitis, atopic dermatitis, urticarial, food allergy, and drug allergy). The cIgE was analyzed using an immune radiometric assay technique and classified according to the value 0.5 IU/ml into normal and high values [7]. We followed up on the possibility of neonates for 8 years through clinical examination for development of the AD (recurrent wheezing, allergic rhinitis, atopic dermatitis, urticarial).
Study design and Statistical analysis
An observational descriptive cross-sectional retrospective study; all statistical analyses were conducted with the use of the Statistical Package for Social Sciences (SPSS Version 16). Descriptive statistical parameters (mean, standard deviation, frequency, and percentage) were calculated for each quantitative variable. The significance of the difference between different means (quantitative data) was tested using Student's t-test or Fisher’s exact test for the difference between two independent means, while different percentages (qualitative data) were tested using Pearson's Chi-square test. The data were assessed to be consistent with the normal distribution. Results were considered statistically significant with a p-value<5%.
Results
The study included 500 neonates; the frequency of cIgE was 214 (42.8%). Comparison between high and normal cIgE groups; family history of AD, smoking in pregnancy, and season of delivery was significantly higher in the high cIgE group (p≤0.001) (Table 1). We followed up 143 neonates of 214 neonates with high cIgE for 8 years. Table 2 showed the characteristics of the follow-up group.
Table 1. Comparison of variables between high and normal cIgE groups
|
Variables |
Total neonates |
High cIgE N=214 |
Normal cIgE N=286 |
P-value |
|
Gender Male, n (%) Female, n (%) |
238 (47.6) 262 (52.4) |
112 (47,06) 102 (38.93) |
126 (52,94) 160 (61.07) |
0.075
|
|
Mode of delivery Cesarean delivery, n (%) vaginal birth, n (%) |
190 (38) 310 (62) |
80 (42.11) 134 (43.23) |
110 (57.89) 176 (56.77) |
0.035 |
|
Gestation age >37 gestation week, n (%) < 37 gestation week, n (%) |
472 (94.4) 28 (5.6) |
204 (43.23) 10 (35.72) |
268 (56.77) 18 (64.28) |
0.850 |
|
Weight at birth >2500 gram, n (%) <2500 gram, n (%) |
456 (91.2) 44 (8.8) |
194 (42.55) 20 (46.45) |
262 (57.45) 24 (53.55) |
0.85 |
|
Smoking during pregnancy Yes, n (%) No, n (%) |
306 (61.2) 194 (38.8) |
154 (50.32) 60 (30.93) |
152 (49.68) 134 (69.07) |
0.0001 |
|
Mode of smoking Positive, n (%) Negative, n (%) |
76 (24.84) 230 (75.16) |
40 (52.64) 114 (49.57) |
36 (47.36) 116 (50.43) |
0.215 |
|
Family history of allergy Yes, n (%) No, n (%) Mother allergy, n (%) Father allergy, n (%) Father and mother allergy, n (%) Brothers or sisters, n (%) Brothers or sisters and one of the parents, n (%) |
246 (49.2) 254 (50.8) 116 (47.15) 46 (18.70) 30 (12.20) 22 (8.95) 32 (13) |
130 (52.84) 84 (33.07) 60 (51.73) 20 (43.48) 26 (86.67) 8 (36.37) 16 (50) |
116 (47.16) 170 (66.73) 56 (48.27) 26 (56.52) 4 (13.33) 14 (63.36) 16 (50) |
0.0001
0.00009 |
|
Season of delivery Winter, n (%) Spring, n (%) Autumn, n (%) Summer, n (%) |
258 (51.6) 108 (21.6) 16 (3.2) 118 (23.6) |
124 (48.07) 52 (48.16) 14 (87.50) 24 (20.34) |
134 (51.93) 56 (51.85) 2 (12.5) 94 (79.66) |
0.00005 |
Table 2. Characterization of the follow-up group
|
Variables |
Follow-up group |
|
|
Family history |
Positive, n (%) |
74 (51.7) |
|
More than 1 symptom, n (%) |
26 (18.2) |
|
|
nasal allergy, n (%) |
18 (12.6) |
|
|
urticarial, n (%) |
4 (2.8) |
|
|
Atopic eczema, n (%) |
5 (3.5) |
|
|
asthma, n (%) |
15 (10.5) |
|
|
Medication or food allergy, n (%) |
6 (4.2) |
|
|
|
Negative, n (%) |
69 (48.3) |
|
Parents relative |
1st degree, n (%) |
11 (7.7) |
|
2nd degree, n (%) |
63 (44.1) |
|
|
No degree, n (%) |
69 (48.3) |
|
|
AD developed |
No symptom, n (%) |
34 (23.8) |
|
childhood asthma |
45 (31.5) |
|
|
nasal allergy, n (%) |
28 (19.6) |
|
|
skin allergy (eczema and urticarial), n (%) |
36 (25.2) |
|
During follow-up, we noticed that AD developed in 109 (76.22%) children of 143 with high cIgE with significant correlation (p-value≤0.001). There was a statistical relationship between the presence of AD in a family history and the development of AD later during the follow-up (p-value≤0.001) (Table 3).
Table 3. The relationship development of AD in children and variables during the follow-up
|
|
Development of AD |
|||||
|
|
skin allergy (eczema and urticarial) |
nasal allergy |
childhood asthma |
No AD |
p-value |
|
|
family history of AD |
NO, n (%) |
3 (4.3) |
22 (31.9) |
19 (27.5) |
25 (36.2) |
0.0001 |
|
Yes, n (%) |
33 (44.6) |
6 (8.1) |
26 (35.1) |
9 (12.2) |
||
|
Parents relative |
1st degree, n (%) |
6 (16.7) |
2 (7.1) |
2 (4.4) |
1 (2.9) |
0.0003 |
|
2nd degree, n (%) |
27 (75) |
4 (14.3) |
24 (53.3) |
8 (23.5) |
||
|
No symptom, n (%) |
3 (8.3) |
22 (78.6) |
19 (42.2) |
25 (73.5) |
||
During the follow-up period, the development of AD increased with the joint presence of two factors (high cIgE and family history of AD) with a rate of 51.7% and with a significant correlation (p-value≤0.001) (Figure 1).
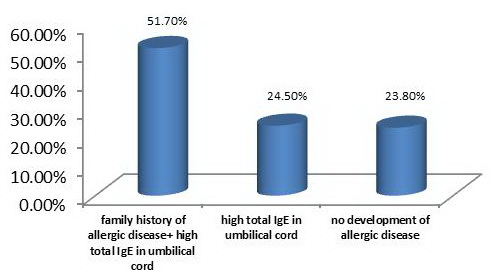
Figure 1. The development of AD with the presence of factors.
Discussion
Our study confirms that high cIgE is associated with the development of AD. This association increased with the presence of two factors (high cIgE and family history of AD). In addition, we could not find any association between neonatal gender and cIgE Consistent with krimi et al 2012 [8]. In contrast to our findings, Mohammad zadeh et al in Iran 2019 found significantly higher levels of cIgE in male newborns [9].
The delivery method did not significantly influence the cIgE in the current study, which was similar to a study by Mohammad Zadeh, et al. [9]. In contrast, Petrovičová et al study reported higher cIgE in cesarean section newborns than in vaginal birth, which could be related to the low number of the sample and vaginal births [10].
The results of most studies found an association between seasonal variation and cIgE that is similar to the present study [13-14]. This could be explained by the effect of the environmental allergens on the cIgE.
In the current study, smoking during pregnancy was associated with cIgE that is consistent with the results of several studies [15-16]. On the other hand, Flores et al study did not find an association between cIgE and exposure to smoking during pregnancy [17].
Interestingly, the present study confirmed the correlation between high cIgE and further clinical development of allergic diseases. Similarly, Lopez et al in Brazil 2001 found that the cIgE predicted the occurrence of allergy in children [18]. On the contrary, Eiriksson T.H et al 1994 reported little importance of cIgE as predicting allergies in children [19].
We confirmed that the combination of allergic family history and cIgE plays an important role in predicting the occurrence of allergies in later childhood. That is similar to Tariq. SM et al 1999 study in British emphasized that the cIgE scan is necessary and required in the event of positive allergic family history [20].
Conclusion
The current study demonstrates the combination of cIgE may be predictive of subsequent allergy onset. This may be used as a predictive measure through which prevention can be achieved by emphasizing parental feeding, preventing smoking in the child's environment, and avoiding allergens.
Acknowledgments
We wish to thank the medical officer, doctors at the Pediatric department, and laboratory assistants at Al-Tishreen University Hospital laboratory who worked with us in reviewing the patients and doing the laboratory analysis.
Conflict of interest
The authors declare that they have no conflict of interest.
Data availability
We cannot share patient data due to our hospital's privacy policy, which is concerned with maintaining patient confidentiality and refuses to publish or share data. Also, the informed consent signed by the parents to participate in the study prevents sharing of information with researchers not participating in our study.
Ethical approval
All parents whose children were studied gave informed consent for the sharing of this research. Ethical clearance for this study was obtained from the Ethics Committee of the University of Tishreen Hospital.
Author contributions
Prof. Ghazal Deeb developed the research idea and implemented the sample collection process. Literature review, data analysis, translation and correspoundence were performed by Leen doya. Reading of final data, and correction of the final version was performed by all authors.
- Baççıoğlu A, Söğüt A, Kılıç Ö, Beyhun E. The Prevalence of Allergic Diseases and Associated Risk Factors in School-Age Children and Adults in Erzurum, Turkey. Turk Thorac J 2015; 16(2): 68-72. https://doi.org/10.5152/ttd.2015.4229.
- Campbell DE, Boyle RJ, Thornton CA, Prescott SL. Mechanisms of allergic disease-environmental and genetic determinants for the development of allergy. Clinical and experimental allergy. Clin Exp Allergy 2015; 45(5): 844-858. https://doi.org/10.1111/cea.12531.
- Brown MA, Halonen MJ, Martinez FD. Cutting the cord: is birth already too late for primary prevention of allergy? Clin Exp Allergy 1997; 27(1): 4-6. https://pubmed.ncbi.nlm.nih.gov/9117879.
- Nabavi M, Ghorbani R, Asadi AM, Faranoush M. Factors associated with cord blood IgE levels. Asian Pac J Allergy Immunol 2013; 31(2): 157-162. https://doi.org/10.12932/ap0234.31.2.2013.
- Kjellman NI, Croner S. Cord blood IgE determination for allergy prediction -- a follow-up to seven years of age in 1,651 children. Ann Allergy 1984; 53(2): 167-171. https://pubmed.ncbi.nlm.nih.gov/6465625.
- Bousquet J, Ménardo JL, Viala JL, Michel FB. Predictive value of cord serum IgE determination in the development of "early-onset" atopy. Ann Allergy 1983; 51(2): 291-295. https://pubmed.ncbi.nlm.nih.gov/6881618.
- Croner S, Kjellman NI, Eriksson B, Roth A. IgE Screening in 1701 Newborn Infants and the Development of Atopic Disease During Infancy. Arch Dis Child 1982; 57(5): 364-368. https://doi.org/10.1136/adc.57.5.364.
- Karimi M, Mojibian M, Nodoshan H, Bidaki R, Kholacezadeh G, Rafiee P, et al. Relationship between stress during pregnancy and cord blood IgE level. Journal of Shahid Sadoughi University of Medical Sciences 2012; 20(2): 142-151. Persian. http://jssu.ssu.ac.ir/article-1-1973-en.html.
- Mohammadzadeh I, Haghshenas M, Asefi S, Alizadeh-Navaei R. IgE level in newborn umbilical cord and its relationship with some maternal factors. Clin Mol Allergy 2019; 17(1): 1-4. https://doi.org/10.1186/s12948-019-0115-1.
- Tu YL, Chang SW, Tsai HJ, Chen LC, Lee WI, Hua MC, et al. Total serum IgE in a population-based study of Asian children in Taiwan: reference value and significance in the diagnosis of allergy. PLoS One 2013; 8(11): e80996. https://doi.org/10.1371/journal.pone.0080996.
- Bergmann RL, Schulz J, Günther S, Dudenhausen JW, Bergmann KE, Bauer CP, et al. Determinants of cord-blood IgE concentrations in 6401 German neonates. Allergy 1995; 50(1): 65-71. https://doi.org/10.1111/j.1398-9995.1995.tb02484.x.
- Hansen LG, Høst A, Halken S, Holmskov A, Husby S, Lassen LB, et al. Cord blood IgE. I. IgE screening in 2814 newborn children. Allergy 1992; 47(4): 391-396. https://doi.org/10.1111/j.1398-9995.1992.tb02078.x.
- Scirica CV, Gold DR, Ryan L, Abulkerim H, Celedón JC, Platts-Mills TA, et al. Predictors of cord blood IgE levels in children at risk for asthma and atopy. J Allergy Clin Immunol. 2007; 119(1): 81-88. https://doi.org/10.1016/j.jaci.2006.09.002.
- Magnusson CG. Maternal smoking influences cord serum IgE and IgD levels and increases the risk for subsequent infant allergy. J Allergy Clin Immunol 1986; 78(5 Pt 1): 898-904. https://doi.org/10.1016/0091-6749 (86)90237-x.
- Flores D'Arcais A, De Biase D, Riva P, Tito A, Crippa L, Mariani E. Influence of maternal smoking on cord serum IgE levels in newborns. Minerva Pediatr 1993; 45(11): 443-447. Italian. https://pubmed.ncbi.nlm.nih.gov/8133835.
- Lopez N, de Barros-Mazon S, Vilela MM, Condino Neto A, Ribeiro JD. Are immunoglobulin E levels associated with early wheezing? A prospective study in Brazilian infants. Eur Respir J 2002; 20(3): 640-645. https://doi.org/10.1183/09031936.02.00219302.
- Eiríksson TH, Sigurgeirsson B, Ardal B, Sigfússon A, Valdimarsson H. Cord blood IgE levels are influenced by gestational age but do not predict allergic manifestations in infants. Pediatr Allergy Immunol 1994; 5(1): 5-10. https://doi.org/10.1111/j.1399-3038.1994.tb00211.x.
- Tariq SM, Arshad SH, Matthews SM, Hakim EA. Elevated cord serum IgE increases the risk of aeroallergen sensitization without increasing respiratory allergic symptoms in early childhood. Clin Exp Allergy 1999; 29(8): 1042-1048. https://doi.org/10.1046/j.1365-2222.1999.00594.x.
Received 11 September 2020, Revised 23 September 2021, Accepted 21 December 2021
© 2020, Russian Open Medical Journal
Correspondence to Leen Jamel Doya. Phone: 0963992856983. E-mail: dr.leen.doya@gmail.com.