Introduction
Melanoma is a very aggressive form of cancer and is capable of rapid and early metastasis [1], which drops the 5-year survival rate from 97% to 10-15 % [1]. Early diagnostics of melanoma is necessary for effective treatment. However, the currently adopted diagnostic methods, based on the analysis of blood samples, have a sensitivity of 47% [2] when applied during the early stages of the disease. Low sensitivity is explained by the small amounts of circulating tumor cells (CTC) that are present in the blood at early stages. Currently adopted invasive techniques involve an injection of probing catheter into major arteries, which can cause several complications including blood clotting, and provide the sensitivity of 58% [3-6].
Several research groups proposed, in 2005-2007, a method of integrated photoacoustic microscopy-cytometry based on the explosion of individual cancer cells to laser pulses and detection of acoustic responses. Similar methods are already used in gas spectroscopy [7], monitoring of the lymph nodes [8], and visualization of breast cancer tumors [9]. Later, in 2009, this approach was applied to the detection of circulating tumor cells [10] in the blood. Recent studies [11] concluded that this noninvasive approach has very high sensitivity and is potentially able to detect even a single cancer cell against tissue and blood background.
Another important problem is the development of precise algorithms that can automatically detect the responses from melanoma cells in real-time. The current approach is based on the calculation of standard deviation or amplitude of acoustic responses, which tend to be higher for melanoma responses in comparison to the responses from normal blood cells. We proposed a different model-based approach, which was based on subtraction of the ensemble average normal acoustic response from melanoma responses. In this study, those two methods were tested and compared on the in vivo murine data.
Material and Methods
Photoacoustic cytometry is based on irradiation of circulating blood using laser pulses. When the blood or CTCs absorbs laser energy they expand and generate acoustic waves due to the photoacoustic effect. Melanoma cells absorb a greater amount of laser energy, in some cases, they even burst from the absorbed heat and release micro-bubbles [11]. In both cases, melanoma cells generate acoustic responses that have different shapes compared to normal blood cells and sometimes have significantly higher amplitudes.
Data, used in this study, was obtained using resonance acoustic piezosensor Imasonic S.A. custom 3.5 MHz single element transducer (IMASONIC SAS, France). The bandwidth of the sensor was limited to 0-6 MHz at -3 dB level. The acoustic signal was intensified by the internal amplifier and digitized using Alazar ATS9350 analog to digital converter with a sample rate of 500 Msps, resolution of 12-bit, and bandwidth of 250 MHz. The duration of analyzed acoustic signals was 8 µs. The beginning of each waveform was synchronized using a pulsed laser with a wavelength of 1064 nm, pulse duration of 2 ns, a pulse repetition rate of 2 kHz, and pulse energy of 100 µJ.
Laboratory animals were kept according to the instructions of the Saratov State Medical University (No. 82 dated January 30, 2020). The care protocol does not contradict the international principles of biomedical animal studies of the 1985 Geneva Convention. The mice from the Saratov State Medical University were studied under an active research protocol approved by the Ethics Committee of Saratov State Medical University (wide approval No. 5) on 29.12.2018. The BALb/c mouse was selected for the experiment. It was 6–8 weeks old and weighing 20–25 g. The surgical part was performed using general anesthesia, intraperitoneal injection of drugs [a mixture of Zoletil (40 mg per kg, 50 μL, Virbac SA, Carros, France), and 2% Rometar (10 μLand 10 mg per kg, Spofa, Czech Republic)]. At the end of the experiment, the animal was sacrificed with an overdose of anesthesia. The mouse carotid artery was cannulated, and 106 of B16F10 cells in DPBS buffer were injected using a syringe pump (AL-1000, World Precision Instruments, USA). The volume of the fluid coming out of the syringe during the minute was 40 μL. The photoacoustic signals were detected on the femoral artery using a US transducer. Successful alignment on the vessel was characterized by the maximum acoustic response, as well as the obvious pulsation of the arterial vessel.
B16F10 cell culture [12] was grown in the Dulbecco’s modified Eagle medium (DMEM) with high glucose concentration (Sigma-Aldrich, US) supplemented with 10% of the fetal bovine serum (FBS) and 1% of the penicillin-streptomycin at 37 °C in 5% CO2 and a humidified atmosphere. The culture medium was changed every three days until monolayer formation was observed. After monolayer formation, cells were detached by 0.25% trypsin solution with 0.02% EDTA. One part of the received cell suspension was mixed with 2 parts of the fresh cell culture medium for trypsin effect neutralization and centrifuged at 1000 rpm for 5 min. After that, the supernatant was aspirated, and the cell pellet was resuspended in an appropriate volume of DPBS. Finally, the cell suspension was stained by 0.4% Trypan blue solution (Invitrogen, US) for 5 min and counted by automated cell counter "Countess" (Invitrogen, US) to estimate cell viability and concentration of cells.
We obtained 1000 different acoustic responses before the injection to be used as control data. After the injection, we manually extracted another set of 1000 acoustic responses from melanoma cells, based on the form of the signals. The signals were filtered using a digital rectangular low-pass filter with a cut-off frequency of 25 MHz [13]. Such cut-off frequency preserves the profile of the signals and reduces high-frequency noises.
The ensemble average acoustic response from normal blood cells, ensemble average acoustic response from circulating melanoma cells, and several typical melanoma responses are shown in Figure 1.

Figure 1. Ensemble average acoustic responses from circulating blood cells. (a) – normal blood cells. (b) – circulating melanoma cells. (c) – three typical non-averaged acoustic responses from the melanoma cells. The colored lines show the median values, the black lines show the lower and upper quartiles of the distributions. The dashed vertical lines show the borders of the gating used when calculating the standard deviation, the solid vertical lines show the gating used when calculating the differential signals.
We tested 2 different methods for automated detection of the melanoma acoustic responses. The first approach, adopted in [2], was based on a calculation of the standard deviation of the acoustic responses. The acoustic responses from circulating melanoma cells tend to have a higher standard deviation comparing to the responses from normal blood cells.
The second approach was based on a calculation of the ensemble average model responses from normal blood cells. The ensemble average response was subtracted from melanoma responses. If the maximal value of the resulting time-series was more than 1.75 mV, then we considered this response to be melanoma-related. From Figure 1, it is evident that all responses from normal cells were rather uniform, so when we subtracted the ensemble average response from other normal blood responses the resulting signals were close to zero. The responses from melanoma cells, however, had prominent second delayed spikes, and the delay was positively correlated with the amplitude of the spike. The signal calculated by subtracting the model response from melanoma responses still contained those spikes, and their amplitudes were higher than 1.75 mV. For brevity, we will refer to such signals as the differential signals.
Another question was choosing which part of the acoustic responses to analyze, or which kind of gating to apply. In the original paper [11] it was advised to use a narrow section around the main spike – 2.9 µs to 3.2 µs. However, we found out that both approaches were more sensitive and selective when using the wide gating that included delayed spikes on melanoma acoustic responses: 2.9-5 ms for calculation of the standard deviation (dashed vertical lines in Figure 1); 3.2-5 ms when using the model-based approach (solid vertical lines in Figure 1), the main spike needed to be excluded because it fluctuated even among the responses from normal cells and negatively effected the sensitivity.
Results
Figure 2 shows the distributions of the standard deviations calculated from an array of normal blood responses and melanoma responses (Figure 2a) and the corresponding ROC curve (Figure 2b). From Figure 2 it is evident that the distribution of the standard deviations calculated from the normal blood responses was significantly narrower than the distribution of the standard deviations calculated from the melanoma responses, which corresponds to the results presented in Figure 1. It is also can be seen that the distributions partially overlap. The parameters of the distributions (Median value, lower quartile, upper quartile) are 2.35 (2.30; 2.41) for the standard deviations of the responses from the normal blood cells; 2.98 (2.75; 3.56) for the standard deviations of the circulating melanoma cells responses. The area under the ROC curve is 0.99 with a sensitivity of 97%, and specificity of 98%.
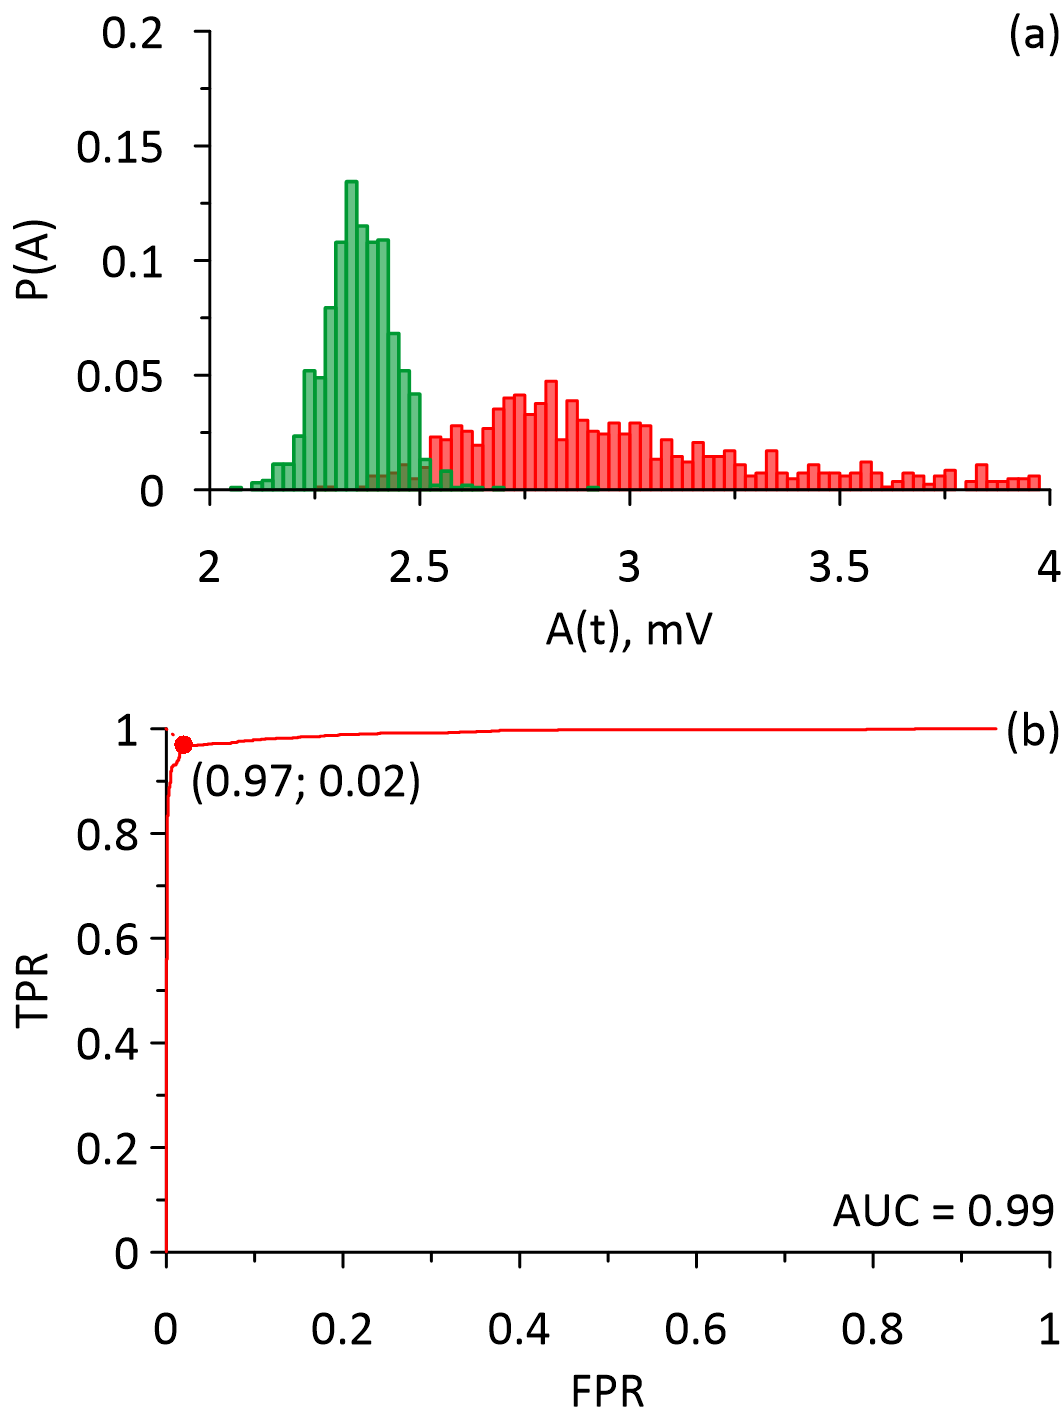
Figure 2. The distributions and the ROC curves that were calculated for the standard deviations of the acoustic responses of the circulating melanoma cells (red) and the normal blood cells (green). (a) – the distributions, (b) – the ROC curve.
Figure 3 shows distributions of the maximal values of differential signals calculated for normal blood responses and melanoma responses (Figure 3a) and the corresponding ROC curve (Figure 3b). From Figure 3 it is evident that the distribution related to normal blood responses was significantly narrower, which also corresponded to the results presented in Figure 1. The distributions also overlap. Parameters of the distributions were 0.82 (0.71; 0.98) for the responses from normal blood cells; 5.46 (3.41; 8.99) for the responses from circulating melanoma cells. The area under the ROC curve was 0.99 with a sensitivity of 99%, and specificity of 98%.
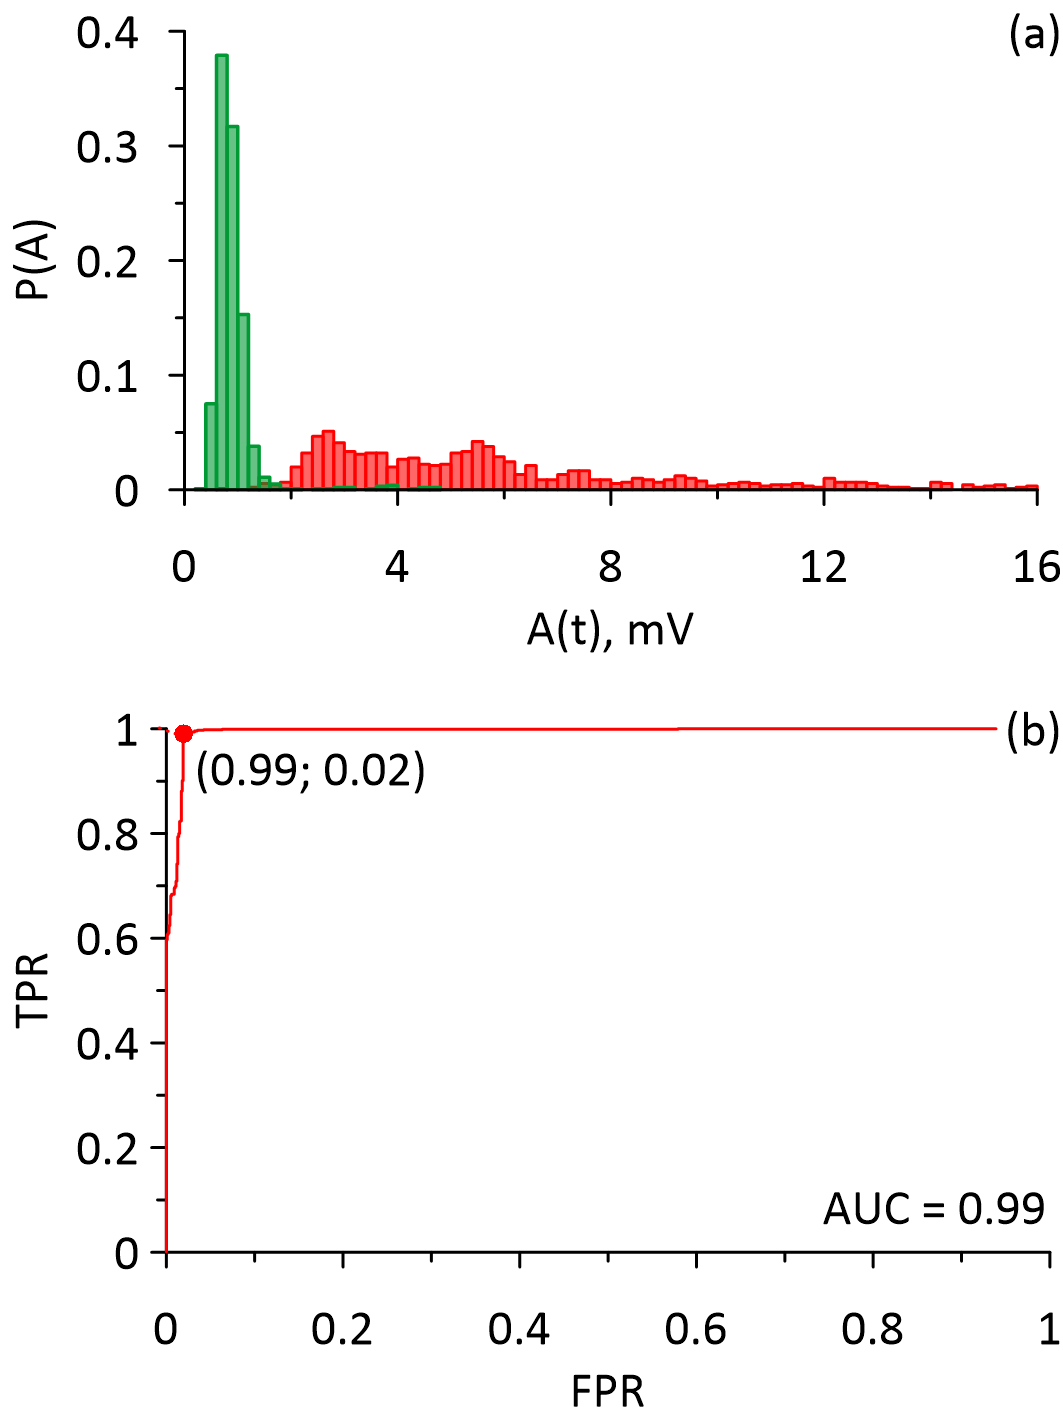
Figure 3. The distributions and the ROC curves that were calculated for the maximal values of the differential signals obtained from the acoustic responses of the circulating melanoma cells (red) and the normal blood cells (green). (a) – the distributions, (b) – the ROC curve.
Discussion
The melanoma detection algorithm that calculated the standard deviation of the acoustic responses had a very high sensitivity of 97%. However, the model-based technique had a sensitivity of 99%, which made it more appropriate for the analysis of the photoacoustic data, since that approach aims to provide the ability to detect even a single circulating melanoma cell.
Another advantage of using the model-based approach is computational speed, which is very important for the real-time detection of circulating melanoma cells. The model-based algorithm is much simpler since it only calculates the differential signals until they reach the value of 1.75 mV.
It is important to mention that the study included the data from a single mouse and that further studies with larger statistics are needed to confirm the results.
Conclusion
The approach based on subtraction of the ensemble average normal response from the melanoma responses provided better sensitivity and specificity when detecting circulating melanoma cells in comparison to the approach based on the calculation of the standard deviation of the acoustic responses.
Obtained results suggest that the proposed model-based approach is a more reliable basis for the development of an automated algorithm for the detection of circulating melanoma cells, and has an additional advantage of being simpler to calculate and requires less computational power to run in real-time.
Ethical approval
In vivo experiment. Laboratory animals were kept according to the instructions of the Saratov State Medical University (No. 82 dated January 30, 2020). The care protocol does not contradict the international principles of biomedical animal studies of the 1985 Geneva Convention.
Acknowledgments
This work was supported by the Government of the Russian Federation (grant no. 14.Z50.31.0044 to support scientific research projects implemented at Russian institutions and Russian institutions of higher education), President program for leading scientific school support, grant no. NSh-2594.2020.2, and RFBR, project number 19-32-90206.
Conflict of interest
Dr. Vladimir Zharov and UAMS have a financial interest in the Technology discussed in this presentation/publication. Dr. Vladimir Zharov has a financial interest in CytoAstra, LLC, which has licensed the Technology. These financial interests have been reviewed and approved in accordance with the UAMS conflict of interest policies.
The other authors declare that they have no conflict of interest.
- Mocellin S, Hoon D, Ambrosi A, Nitti D, Rossi CR. The prognostic value of circulating tumor cells in patients with melanoma: A systematic review and meta-analysis. Clin Cancer Res 2006; 12(15): 4605-4613. https://doi.org/10.1158/1078-0432.ccr-06-0823.
- Hong B, Zu Y. Detecting circulating tumor cells: current challenges and new trends. Theranostics 2013; 3(6): 377‐394. https://doi.org/10.7150/thno.5195.
- Gorges TM, Penkalla N, Schalk T, Joosse SA, Riethdorf S, Tucholski J, et al. Enumeration and molecular characterization of tumor cells in lung cancer patients using a novel in vivo device for capturing circulating tumor cells. Clin Cancer Res 2016; 22(9): 2197-206. https://doi.org/10.1158/1078-0432.ccr-15-1416.
- Khorana AA, Francis CW, Culakova E, Kuderer NM, Lyman GH. Thromboembolism is a leading cause of death in cancer patients receiving outpatient chemotherapy. J Thromb Haemost 2007; 5(3): 632‐634. https://doi.org/10.1111/j.1538-7836.2007.02374.x.
- Sparsa A, Durox H, Doffoel-Hantz V, Munyangango EM, Bédane C, Cendras J, et al. High prevalence and risk factors of thromboembolism in stage IV melanoma. J Eur Acad Dermatol Venereol 2011; 25(3): 340-344. https://doi.org/10.1111/j.1468-3083.2010.03795.x.
- Uchino K. The balance of risk of bleeding and thrombosis in melanoma patients with brain metastases. Melanoma Res 2013; 23(1): 82. https://doi.org/10.1097/cmr.0b013e32835bc415.
- Zharov VP, Letokhov VS. Laser Optoacoustic Spectroscopy. Berlin, Heidelberg: Springer. 1986; 329 p. https://doi.org/10.1007/978-3-540-39492-1.
- Stoffels I, Morscher S, Helfrich I, Hillen U, Leyh J, Burton NC, et al. Metastatic status of sentinel lymph nodes in melanoma determined noninvasively with multispectral optoacoustic imaging. Sci Transl Med 2015; 7(317): 317ra199. https://doi.org/10.1126/scitranslmed.aad1278.
- Ermilov SA, Khamapirad T, Conjusteau A, Leonard MH, Lacewell R, Mehta K, et al. Laser optoacoustic imaging system for detection of breast cancer. J Biomed Opt 2009; 14(2): 024007. https://doi.org/10.1117/1.3086616.
- Galanzha EI, Shashkov EV, Spring PM, Suen JY, Zharov VP. In vivo, noninvasive, label-free detection and eradication of circulating metastatic melanoma cells using two-color photoacoustic flow cytometry with a diode laser. Cancer Res 2009; 69(20): 7926‐7934. https://doi.org/10.1158/0008-5472.can-08-4900
- Galanzha EI, Menyaev YA, Yadem AC, Sarimollaoglu M, Juratli MA, Nedosekin DA, et al. In vivo liquid biopsy using Cytophone platform for photoacoustic detection of circulating tumor cells in patients with melanoma. Sci Transl Med 2019; 11(496): eaat5857. https://doi.org/10.1126/scitranslmed.aat5857.
- Fidler IJ. From here to there; a life based on migration. An interview with Isaiah J. Fidler. Int J Dev Biol 2004; 48(5-6): 457‐462. https://doi.org/10.1387/ijdb.041790ih.
- Ishbulatov YuM, Skazkina VV, Karavaev AS, Inozemtseva OA, Bratashov DN, Abdurashitov AS, Grishin OV, Hramkov AN, Zharov VP. Comparing the spectral properties of the laser-induced acoustic responses from blood and cancer cells in vitro. Russ Open Med J 2020; 9(2): e0209. https://doi.org/10.15275/rusomj.2020.0209.
Received 18 February 2021, Revised 2 July 2021, Accepted 27 July 2021
© 2021, Russian Open Medical Journal
Correspondence to Yurii M. Ishbulatov. Address: Research Institute of Cardiology, Saratov State Medical University, 112, Bolshaya Kazachya str., Saratov, 410012, Russia. E-mail: ishbulatov95@mail.ru.