Introduction
Hyperuricemia is a disorder of purine metabolism. It is considered a risk factor for a number of chronic diseases (diabetes mellitus, metabolic syndrome, cardiovascular diseases) rather than gout alone [1-3]. Data from the National Health and Nutrition Examination Survey (NHANES) in the United States showed that average uric acid levels and hyperuricemia prevalence between 2007 and 2016 were somewhat stabilized [4]. On the other hand, in some countries, there was an increase in hyperuricemia prevalence [5, 6]: for example, in Ireland, from 2006 to 2014, its occurrence grew from 19.7% to 25.0% in men and from 20.5% to 24.1% in women [7]. The upward trend in hyperuricemia prevalence is linked to growing incidence of obesity and metabolic syndrome, sedentary lifestyle, ‘western type’ diet, along with use of pharmaceutical drugs increasing uric acid levels (such as diuretics) [8].
Most genes associated with gout or uric acid levels in blood serum are involved in the renal-uric transport system [9]. For example, the urate transporter genes SLC2A9, ABCG2, and SLC22A12 modulate serum uric acid levels and the risk of gout. The net balance between absorption and secretion of renal urate is the main factor defining uric acid concentration in serum and loss of function mutations in SLC2A9 and SLC22A12, which cause hereditary hypouricemia based on decrease in urate absorption and urate secretion without response. At the same time, hyperuricemia is perceived as a multifactorial chronic disease that can be associated with multiple lifestyle factors, including alcohol consumption, smoking, physical activity, and nutrition. Besides, numerous studies demonstrated the age- and gender-dependent interaction of lifestyle factors [10-12].
According to the multicenter research project ESSE-RF in 2013-2014, hyperuricemia prevalence in Russia reached 16.8% (25.3% in men and 11.3% in women) [13]. The study confirmed a number of associations of hyperuricemia prevalence with gender, age, and some lifestyle characteristics. However, interaction of lifestyle factors in men and women, as well as their relative contribution into the likelihood of hyperuricemia, remains unexplored.
The objective of our study was analyzing gender-related specificities of hyperuricemia associations with lifestyle choices in the Russian Federation (RF) population.
Materials and Methods
General features of the sample
The total number of examined people from 13 RF regions participating in 2013-2014 in a multicenter epidemiological study, “Epidemiology of Cardiovascular Diseases in the Regions of the Russian Federation” (ESSE-RF), was 21923, ranging 25-64 YO. To form a sample, the study used the Kish Selection Method, which provided for a systematic, multi-stage, random patient selection on the basis of medical institutions in accordance with territorial principle. The regions included in the ESSE-RF study were similar in their socio-demographic characteristics to the RF as a whole, which allowed extrapolating the results to overall RF population. More detailed information on sample selection and research protocol of the ESSE-RF was published earlier [14].
The study was conducted in accordance with the standards of good clinical practice and Declaration of Helsinki principles. The research protocols were approved by the Ethics Committee of the Federal State Budgetary Institution (FSBI) National Medical Research Center (NMRC) for Preventive Medicine of the RF Ministry of Healthcare, FSBI NMRC of Cardiology of the RF Ministry of Healthcare, FSBI Almazov NMRC, as well as by collaborating centers in the regions, where the study was carried out. Prior to inclusion into the study, all participants signed written informed consent. The response to the survey was about 80%.
Missing data
Of the total participant pool, some essential data were missing for 4753 people (21.7%). The largest number of omissions was recorded for dietary preferences (2356 observations, or 10.7% of the sample) and alcohol consumption (2522 observations, or 11.5%). For marital status, education level, income, weight and height indicators, smoking, and uric acid levels, the amount of missing data ranged from 23 to 769 observations (0.1%-3.5% of the sample). The largest proportion of missing data was detected among rural dwellers, men, people 35 YO and older, as well as in a number of regions (Table 1).
Table 1. Missing values depending on major demographic traits.
|
Characteristic/Trait |
Missing values |
Р-values |
||
|
Number |
% |
|||
|
Settlement type |
Urban |
3795 |
21.4 |
0.041 |
|
Rural |
958 |
22.8 |
||
|
Gender |
Women |
2782 |
20.5 |
<0.00001 |
|
Men |
1971 |
23.5 |
||
|
Age, YO |
25-34 |
912 |
19.9 |
0.015 |
|
35-44 |
981 |
22.4 |
||
|
45-54 |
1355 |
22.1 |
||
|
55-64 |
1505 |
22.0 |
||
|
Region |
Volgograd |
596 |
40.5 |
<0.00001 |
|
Vologda |
239 |
14.8 |
||
|
Voronezh |
191 |
12.0 |
||
|
Ivanovo |
310 |
16.6 |
||
|
Kemerovo |
165 |
10.2 |
||
|
Samara |
144 |
9.1 |
||
|
St. Petersburg |
430 |
27.1 |
||
|
Orenburg |
333 |
21.1 |
||
|
Tomsk |
284 |
17.7 |
||
|
Tyumen |
372 |
22.7 |
||
|
Vladikavkaz |
938 |
43.7 |
||
|
Krasnoyarsk |
188 |
12.4 |
||
|
Vladivostok |
563 |
26.7 |
||
Partial restoration (imputation) of missing data was carried out using the k-nearest neighbors algorithm. Data imputation was conducted according to the input parameters: region, urban/rural settlement, gender, age. For covariates of marital status, education, and income level, an imputation was performed for all missing values. For the studied predictors (dietary pattern, alcohol consumption, and smoking) and response (hyperuricemia), the imputation was carried out for those cases, where just one parameter was missed. Thus, the data were recovered for a total of 3611 cases. Hence, 1142 cases (5.2%) remained with missing data, while the final sample size for the participants with complete data (initial or restored) amounted to 20781 individuals.
Socio-economic characteristics and smoking
As for marital status, we distinguished two categories: ‘family’ group, which included living together in a married or committed relationship, and the ‘no family’ group with single, divorced, or separated people, along with widows or widowers.
By education level, there were groups of study participants with or without completed higher education.
Affluence was assessed indirectly on the basis of three issues, characterizing the share of income spent on food, the respondents' opinion on financial capabilities of the family, and on their security in comparison with other families. Each question had five answer options ranging from 1-5 points. By the sum of points, tertiles were calculated, in accordance with the values of which all respondents were grouped into three categories: ‘low income’ – from 3-7.2 points, ‘medium income’ – from 8-10.3 points, and ‘high income’ – from 11-15 points.
By smoking status, three groups were identified: ‘smokers’ (smoking one or more cigarettes per day), ‘quitters’ (those who quit smoking) and ‘non-smokers’ (who never did).
Nutrition rating
Nutrition assessment was carried out via empirical models, allowing comprehensive analysis of the diet in respondents according to actual frequency of consumption of various food groups [15, 16]. The frequency of a food group consumption was estimated using the following categories of the questionnaire data: “I do not, or rarely, consume”, “1-2 times a month”, “1-2 times a week”, “(almost) daily”. Of the 13 evaluated food groups, 4 characterize dairy products: ‘milk, kefir, yogurt’, ‘sour cream, cream’, ‘cottage cheese’, ‘cheese’. In the initial statistical analysis, the frequencies of consumption of these products highly correlated. Besides, application of the principle component analysis (PCA) suggested that they should be combined into a single stable group. In order to combine these four food products into a single enlarged group ‘dairy products’, a factor analysis procedure (principal component method) was performed, resulting in identification of the latent factor and in subsequent assessment of individual predisposition of each participant to this factor. To bring the gradation scale of consumption frequency of dairy products to uniformity with other food groups, quantitative predisposition values were translated into four subjective categories: for values up to – 1.000 – “I do not, or rarely, consume”, from – 1.000 to 0.000 – “1-2 times a month”, from 0.000 to 1.000 – “1-2 times a week”, from 1.000 and above – “(almost) daily”.
The final nutritional analysis included 10 food groups. To apply PCA, consumption frequencies for all food groups were interpreted in terms of subjectively chosen quantitative points: “I do not, or rarely, consume” – 1 point, “1-2 times a month” – 2 points, “1-2 times a week” – 3 points, “(almost) daily” – 4 points. In the course of determining the optimal number of diets, factors with eigenvalues >1.0 were considered, followed by a cut-off estimation by Cattell’s scree plot. To simplify the structure of factors and improve their interpretability, the selected factors were subjected to orthogonal varimax rotation. Dietary patterns (DP) were described on the basis of food products with the highest absolute loading values for each factor. It should be noted that foods with a positive loading values were characteristic of the diet, while foods with a negative loading values were negatively related to the diet. Factor loading of |≥0.4| for food products was considered making a significant contribution to the structure of the factor. A total of four DPs were specified: ‘smart’ (dairy products, sweets and pastries, fruits and vegetables, cereals and pasta), ‘salty’ (Sausages, frankfurters, offal, pickled and marinated foods), ‘meat’ (red meat, fish and seafood, poultry), ‘mixed’ (legumes, pickled and marinated foods, fish and seafood). The selected DPs and the factor loadings of food groups are presented in Table 2. The designation of dietary choices was based on interpretation of food products for each factor. According to their individual predisposition to each DP, the study participants were divided into quartiles, with the 1st quartile characterized by low adherence to the diet, and the 4th quartile characterized by high adherence.
Table 2. Factor loadings of major identified nutritional patterns
|
Food groups |
Smart |
Salty |
Meat |
Mixed |
|
Meat (beef, pork, lamb, etc.) |
-0.054 |
0.232 |
0.645 |
-0.088 |
|
Fish and seafood |
0.039 |
-0.125 |
0.644 |
0.436 |
|
Poultry (chicken, turkey, etc.) |
0.135 |
0.091 |
0.643 |
-0.077 |
|
Sausages, frankfurters, offal (tongue, liver, heart, etc.) |
0.042 |
0.754 |
0.141 |
-0.070 |
|
Pickled and marinated foods |
0.001 |
0.609 |
0.083 |
0.472 |
|
Cereals, pasta |
0.471 |
0.284 |
0.124 |
0.082 |
|
Fruits and vegetables |
0.545 |
-0.287 |
0.364 |
0.071 |
|
Legumes (beans, lentils, peas, etc.) |
0.105 |
0.035 |
-0.068 |
0.837 |
|
Sweets and pastries (candies, jams, cookies, etc.) |
0.675 |
0.345 |
-0.059 |
-0.186 |
|
Dairy products (milk, kefir, yogurt, sour cream, cream, cottage cheese, cheese) |
0.764 |
-0.229 |
-0.046 |
0.210 |
|
The proportion of explained variance, % |
15.9 |
13.5 |
14.3 |
12.2 |
The factor loadings of food group consumption frequency exceeding 0.400 or under – 0.400 are given in bold.
Estimated alcohol consumption
Alcohol consumption was estimated during interviews using questionnaires based on frequency, volume and type of alcoholic beverages consumed. The volume of alcohol consumed per year was calculated, followed by conversion into average daily values in grams of ethanol. When computing the consumption volumes of various alcoholic beverages, we assumed the following ethanol content per 1 ml: beer – 0.04 g, dry wine and champagne – 0.0927 g, fortified wine and port – 0.1227 g, homemade tinctures – 0.3227 g, strong alcohol (vodka, cognac, whiskey, etc.) – 0.3227 g. A group of people who did not drink alcohol at all stood out. Among alcohol drinkers, the values of the 25th and 75th percentiles were calculated, according to which the grouping was conducted on light (below 0.62 g of ethanol per day), moderate (0.62-5.74 g), and excessive consumption (5.75 g and above).
Anthropometric and biochemical studies
Height and weight were measured by conventional methods. Body mass index (BMI) was calculated using Quetelet formula: weight (kg)/[height ×height (m2)]. Grouping by BMI value range: normal BMI – below 25.0 kg/m2, increased BMI – 25.0-29.9 kg/m2, obesity – 30.0 kg/m2 and higher.
Fasting blood from the ulnar vein was used to determine the uric acid level. After centrifugation, the serum was frozen and delivered to a federal center, where biochemical analyses were performed. Uric acid was determined via uricase method on an Architect 8000 biochemical analyzer (USA) by Abbott reagents. Hyperuricemia was diagnosed at a uric acid level of over 400 μmol/L for men and above 360 μmol/L for women.
Statistical Analysis Methods
Categorical data were presented in percent. Bilateral associations of categorical variables were evaluated using the Pearson’s Chi-squared test. A multivariate analysis of associations of age and lifestyle choices with hyperuricemia was performed using logistic regression adjusted for marital status, education level, material wealth, region and type of residence (urban/rural), as well as simultaneously adjusted for age and lifestyle characteristics. Results were expressed as odds ratios (OR) and 95% confidence intervals (CI). During the initial analysis, we identified age-gender and lifestyle choices-gender interrelations, and therefore, the final analysis of our data was conducted separately for men and women.
To build a model for predicting hyperuricemia, split selection method for classification trees was used: full enumeration of trees with univariate splits, employing the C&RT-style exhaustive search for univariate splits. As criteria for prediction accuracy, equal misclassification cost of objects and equal prior probabilities, proportional to the size of the classes of dependent variable, were assigned. The stopping split was performed according to the FACT-style direct stopping rule with a fraction of unclassified objects not exceeding 0.1. Based on the analysis results, the rank importance of independent predictors was evaluated, from 1 to 100, where 1 is low importance, and 100 stands for high importance. Based on the number of correctly predicted cases of hyperuricemia presence/absence, the sensitivity, specificity and general predictive value of the models (accuracy) were calculated.
All statistical analyzes were performed using Statistica software, version 10.0 (StatSoft Inc., USA). A critical level of statistical significance was 0.05.
Results
Hyperuricemia prevalence by gender and social characteristics
Table 3 presents the hyperuricemia prevalence in the overall sample, depending on gender and social characteristics of the study participants. Among men, hyperuricemia prevalence was higher (20.5%) compared with women (13.4%), p<0.00001. In addition, hyperuricemia was more common among urban residents, families with no higher education, as well as in a number of regions (in decreasing order: Krasnoyarsk Territory, Primorsky Territory; Voronezh, Ivanovo, Tomsk, Vologda Regions, St. Petersburg). No statistically significant differences were found in terms of income.
Table 3. General trends of hyperuricemia prevalence depending on gender and basic social characteristics
|
Traits/Characteristics |
Hyperuricemia |
Р-values |
||
|
Number |
% |
|||
|
Gender |
Women, 13006 |
1743 |
13.4 |
<0.00001 |
|
Men, 7775 |
1595 |
20.5 |
||
|
Settlement type |
Urban, 16822 |
2763 |
16.4 |
0.0034 |
|
Rural, 3959 |
575 |
14.5 |
||
|
Marital status |
No family, 7289 |
1105 |
15.2 |
0.0092 |
|
Family, 13492 |
2233 |
16.5 |
||
|
Education |
Not higher, 11761 |
1947 |
16.5 |
0.027 |
|
Higher, 9020 |
1391 |
15.4 |
||
|
Income |
Low, 3462 |
532 |
15.4 |
0.17 |
|
Medium, 13590 |
2173 |
16.0 |
||
|
High, 3729 |
633 |
17.0 |
||
|
Region |
Volgograd, 1298 |
157 |
12.1 |
<0.00001 |
|
Vologda, 1599 |
261 |
16.3 |
||
|
Voronezh, 1533 |
287 |
18.7 |
||
|
Ivanovo 1847 |
329 |
17.8 |
||
|
Kemerovo, 1571 |
213 |
13.6 |
||
|
Samara 1574 |
169 |
10.7 |
||
|
St. Petersburg, 1539 |
239 |
15.5 |
||
|
Orenburg, 1526 |
226 |
14.8 |
||
|
Tomsk, 1561 |
265 |
17.0 |
||
|
Tyumen, 1479 |
188 |
12.7 |
||
|
Vladikavkaz,1729 |
142 |
8.2 |
||
|
Krasnoyarsk, 1473 |
397 |
26.9 |
||
|
Vladivostok, 2052 |
465 |
22.7 |
||
Associations of hyperuricemia with age and lifestyle choices
Tables 4 and 5 present unifactorial and multifactorial associations of hyperuricemia in women and men. Univariate analysis indicated the association of hyperuricemia with age, BMI, ‘smart’ DP, ‘meat’ DP, alcohol consumption, and smoking (men). The covariate adjustment has partially changed the statistical significance of the associations. In women, compared with the youngest age, at the age of 35-44 yo, the probability of hyperuricemia was lower (OR=0.78; 95% CI: 0.69-0.88), while in the older age group (55-64 yo) it was higher (OR=1.29; 95% CI: 1.16-1.42). As for men, the associations with age were not detected.
Table 4. Associations of hyperuricemia with age and lifestyle characteristics (women)
|
Traits/Characteristics |
Hyperuricemia |
Probability |
|||||
|
Number |
% |
Р-values |
ОR |
95% CI |
Р-values |
||
|
Age, YO |
25-34 |
181 |
7.8 |
<0.00001 |
Reference values |
||
|
35-44 |
217 |
8.7 |
0.78 |
0.69-0.88 |
0.00007 |
||
|
45-54 |
521 |
13.7 |
1.05 |
0.95-1.15 |
0.32 |
||
|
55-64 |
824 |
18.6 |
1.29 |
1.16-1.42 |
<0.00001 |
||
|
BMI |
<25.0 |
225 |
5.2 |
<0.00001 |
Reference values |
||
|
25.0-29.9 |
438 |
11.0 |
0.97 |
0.89-1.06 |
0.54 |
||
|
≥ 30.0 |
1080 |
23.1 |
2.29 |
2.12-2.48 |
<0.00001 |
||
|
‘Smart’ dietary pattern |
1 quartile |
457 |
16.7 |
<0.00001 |
Reference values |
||
|
2 quartile |
384 |
13.4 |
1.02 |
0.93-1.12 |
0.69 |
||
|
3 quartile |
491 |
12.8 |
0.94 |
0.86-1.03 |
0.18 |
||
|
4 quartile |
411 |
11.5 |
0.84 |
0.77-0.93 |
0.00041 |
||
|
‘Salty’ dietary pattern |
1 quartile |
546 |
14.4 |
0.19 |
Reference values |
||
|
2 quartile |
481 |
13.0 |
0.96 |
0.87-1.05 |
0.35 |
||
|
3 quartile |
382 |
13.0 |
0.96 |
0.87-1.05 |
0.38 |
||
|
4 quartile |
334 |
13.0 |
1.01 |
0.91-1.12 |
0.83 |
||
|
‘Meat’ dietary pattern |
1 quartile |
476 |
12.2 |
0.00099 |
Reference values |
||
|
2 quartile |
406 |
13.4 |
1.04 |
0.95-1.15 |
0.40 |
||
|
3 quartile |
416 |
13.0 |
0.99 |
0.90-1.09 |
0.93 |
||
|
4 quartile |
445 |
15.5 |
1.06 |
0.97-1.17 |
0.21 |
||
|
‘Mixed’ dietary pattern |
1 quartile |
476 |
12.7 |
0.085 |
Reference values |
||
|
2 quartile |
390 |
12.6 |
0.94 |
0.85-1.04 |
0.21 |
||
|
3 quartile |
436 |
14.2 |
1.08 |
0.99-1.19 |
0.095 |
||
|
4 quartile |
441 |
14.2 |
1.06 |
0.96-1.16 |
0.23 |
||
|
Alcohol consumption
|
None |
477 |
14.1 |
0.0020 |
Reference values |
||
|
Light |
543 |
14.2 |
0.94 |
0.85-1.03 |
0.17 |
||
|
Moderate |
584 |
12.0 |
0.91 |
0.83-0.99 |
0.043 |
||
|
Excessive |
139 |
15.2 |
1.24 |
1.06-1.45 |
0.0075 |
||
|
Smoking |
None |
1346 |
13.4 |
0.99 |
Reference values |
||
|
Quit |
187 |
13.4 |
1.01 |
0.87-1.14 |
0.83 |
||
|
Smoker |
210 |
13.5 |
1.00 |
0.89-1.16 |
0.99 |
||
Table 5. Associations of hyperuricemia with age and lifestyle characteristics (men).
|
Traits/Characteristics |
Hyperuricemia |
Probability |
|||||
|
Number |
% |
Р-values |
ОR |
95% CI |
Р-values |
||
|
Age, YO |
25-34 |
364 |
17.8 |
0.0055 |
Reference values |
||
|
35-44 |
358 |
21.6 |
1.04 |
0.94-1.16 |
0.45 |
||
|
45-54 |
442 |
21.9 |
0.99 |
0.90-1.09 |
0.82 |
||
|
55-64 |
431 |
20.9 |
0.91 |
0.82-1.01 |
0.066 |
||
|
BMI |
<25.0 |
222 |
9.5 |
<0.00001 |
Reference values |
||
|
25.0-29.9 |
677 |
20.1 |
1.07 |
0.98-1.15 |
0.12 |
||
|
≥ 30.0 |
696 |
33.8 |
2.12 |
1.94-2.31 |
<0.00001 |
||
|
‘Smart’ dietary pattern |
1 quartile |
569 |
23.5 |
0.00001 |
Reference values |
||
|
2 quartile |
478 |
20.8 |
1.04 |
0.94-1.15 |
0.45 |
||
|
3 quartile |
319 |
18.9 |
0.92 |
0.83-1.04 |
0.16 |
||
|
4 quartile |
229 |
16.8 |
0.85 |
0.75-0.96 |
0.0076 |
||
|
‘Salty’ dietary pattern |
1 quartile |
286 |
20.9 |
0.37 |
Reference values |
||
|
2 quartile |
420 |
21.6 |
1.05 |
0.95-1.16 |
0.35 |
||
|
3 quartile |
441 |
20.3 |
0.98 |
0.89-1.08 |
0.74 |
||
|
4 quartile |
448 |
19.5 |
0.99 |
0.90-1.09 |
0.83 |
||
|
‘Meat’ dietary pattern |
1 quartile |
336 |
18.8 |
0.047 |
Reference values |
||
|
2 quartile |
397 |
19.7 |
0.96 |
0.87-1.06 |
0.44 |
||
|
3 quartile |
432 |
22.0 |
1.09 |
0.99-1.20 |
0.089 |
||
|
4 quartile |
430 |
21.5 |
1.01 |
0.91-1.11 |
0.88 |
||
|
‘Mixed’ dietary pattern |
1 quartile |
412 |
19.7 |
0.63 |
Reference values |
||
|
2 quartile |
379 |
20.2 |
1.01 |
0.91-1.11 |
0.93 |
||
|
3 quartile |
380 |
20.8 |
0.98 |
0.86-1.09 |
0.72 |
||
|
4 quartile |
424 |
21.3 |
1.04 |
0.94-1.15 |
0.40 |
||
|
Alcohol consumption
|
None |
244 |
17.5 |
<0.00001 |
Reference values |
||
|
Light |
104 |
16.8 |
0.87 |
0.73-1.03 |
0.12 |
||
|
Moderate |
562 |
19.7 |
1.03 |
0.93-1.14 |
0.62 |
||
|
Excessive |
685 |
23.6 |
1.18 |
1.07-1.31 |
0.0013 |
||
|
Smoking |
None |
522 |
19.9 |
<0.00001 |
Reference values |
||
|
Quit |
581 |
26.5 |
1.23 |
1.14-1.34 |
0.00001 |
||
|
Smoker |
492 |
16.6 |
0.80 |
0.74-0.87 |
<0.00001 |
||
For obesity, the likelihood of hyperuricemia was higher in both women (OR=2.29; 95% CI: 2.12-2.48) and men (OR=2.12; 95% CI: 1.94-2.31), as compared with a normal body weight.
High adherence to the ‘smart’ DP was associated with a decrease in the hyperuricemia likelihood in both women (OR=0.84; 95% CI: 0.77-0.93) and men (OR=0.85; 95% CI: 0.75-0.96), when compared with the 1st quartile (reference values).
For other DPs, no associations with hyperuricemia were found in both gender groups.
Both women and men with excessive consumption of alcohol were more likely to have hyperuricemia than nondrinkers: OR=1.24; 95% CI: 1.06-1.45 and OR=1.18; 95% CI: 1.07-1.31, respectively. Additionally, in women with moderate alcohol consumption, we also observed a lower likelihood of hyperuricemia (OR=0.91; 95% CI: 0.83-0.99).
Associations of hyperuricemia with a smoking status were recorded for men only. Compared with men who never smoked, those who quit smoking were more likely to have hyperuricemia (OR=1.23; 95% CI: 1.14-1.34), while smokers, on the contrary, were less likely to have it (OR=0.80; 95% CI: 0.74-0.87).
Predictive models of hyperuricemia
The indicators included in the predictive models of hyperuricemia prevalence, and the directions of predicted trends mainly corresponded to the results of logistic regression analysis. At the first level, women with normal BMI were classified as ‘not having hyperuricemia’, with obesity – as ‘having hyperuricemia’ (Figure 1). Lifestyle characteristics (alcohol consumption) affected the prediction of hyperuricemia only in women with high BMI. In the age groups of 25-34, 35-44, and 45-54 (YO), excessive consumption of alcohol caused increase in hyperuricemia incidence, whereas in the older age group (55-64 YO), moderate alcohol consumption favored lack of this ailment. The accuracy, sensitivity and specificity of this model were 60.4%, 72.9% and 58.4%, respectively.

Figure1. Predictive model of the hyperuricemia likelihood in women. HU – hyperuricemia; BMI: 1 – normal weight, 2 – increased weight, 3 – obesity; Age: 1 – 25-34 лYO, 2 – 35-44 YO, 3 – 45-54 YO, 4 – 55-64 YO; Alc (alcohol): 1 – nondrinker, 2 – light consumption, 3 – moderate consumption, 4 – excessive consumption.
In men, as in women, the first stratification of the sample was carried out based on BMI (Figure 2). In men with augmented BMI, the likelihood of hyperuricemia was determined by a combination of their smoking status, alcohol consumption and adherence to ‘smart’ DP. For those, who quit smoking, high adherence to ‘smart’ DP favored the prediction of no hyperuricemia. Both in non-smokers and smokers, not drinking, low or moderate alcohol consumption favored same prediction as well. With excessive alcohol consumption, smoking was prognostically favorable. The accuracy, sensitivity and specificity of the model for predicting hyperuricemia in men were 65.7, 58.9% and 67.5%, correspondingly.
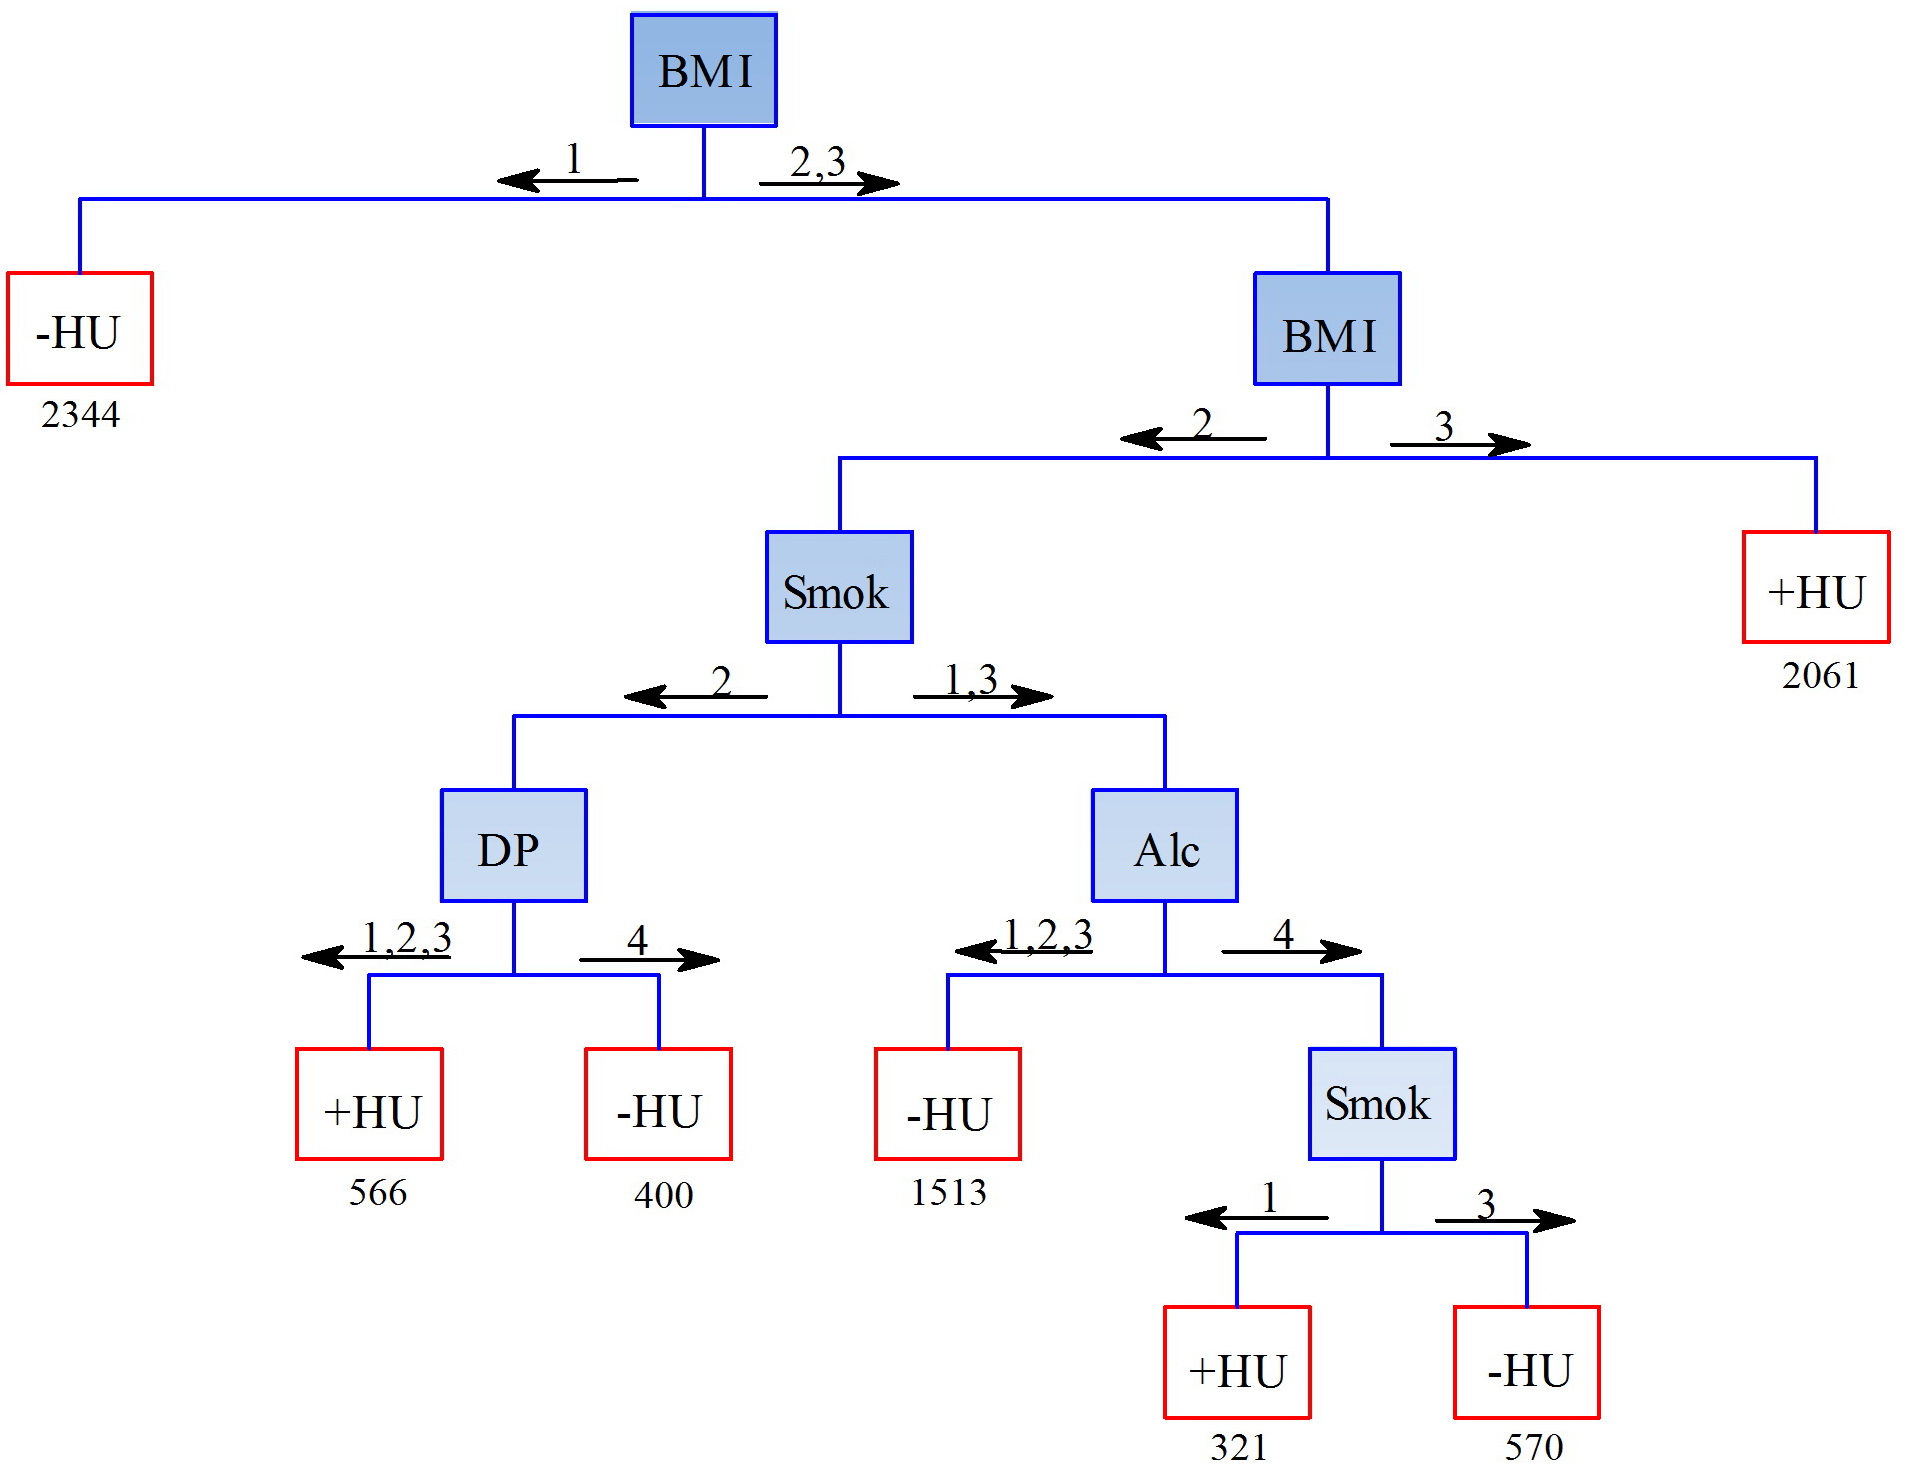
Figure 2. Predictive model of the hyperuricemia likelihood in men. HU – hyperuricemia; BMI: 1 – normal weight, 2 – increased weight, 3 – obesity; Smok (smoking): 1 – nonsmokers, 2 – quit, 3 – smokers; DP (‘Smart’ dietary pattern): 1, 2, 3, 4 – quartiles of adherence to the ‘Smart’ dietary pattern; Alc (alcohol): 1 – nondrinker, 2 – light consumption, 3 – moderate consumption, 4 – excessive consumption.
Based on the analysis of classification trees, the ranking significance of the studied predictors was compared in predicting the likelihood of hyperuricemia in men and women (Figure 3). BMI (100) was the most significant predictor in both gender groups; however, the next predictors differed among men and women in terms of their significance. For women, age was a highly significant predictor (64; for men: 24). For men, smoking was highly significant (63; for women: 23). The significance of alcohol consumption (39 and 40, respectively) and the adherence to diets for women and men were similar (‘smart’ DP – 31 and 47, ‘salty’ DP – 9 and 7, ‘meat’ DP – 24 and 27, ‘mixed’ DP – 8 and 7).
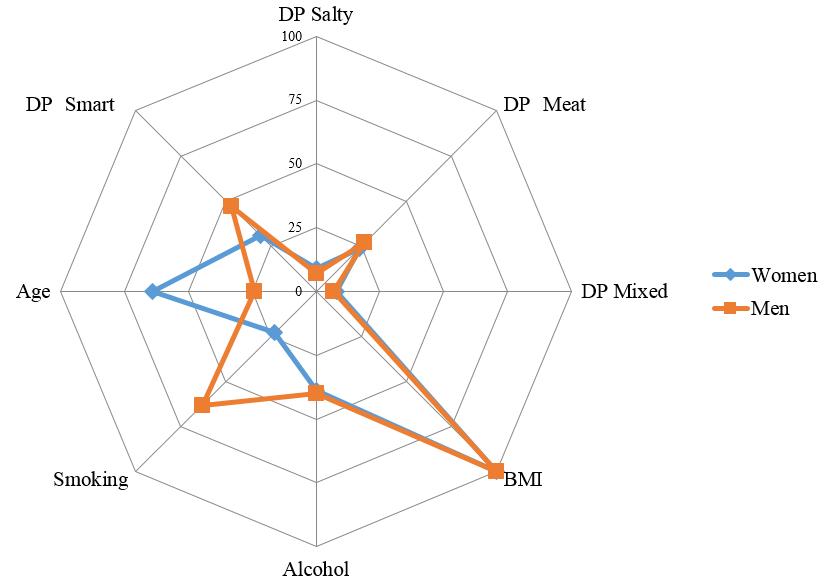
Figure 3. Significance of lifestyle factors in predicting the hyperuricemia likelihood in men and women.
Discussion
Gender-based features of hyperuricemia
The results of our study for the first time demonstrated the gender specificities of the hyperuricemia associations with lifestyle choices in RF population. In the Russian population, the prevalence of hyperuricemia was higher among men compared with women, which was consistent with the results of the vast majority of similar studies [17-21]. Some studies, on the contrary, indicated a higher prevalence of hyperuricemia among women, which was most likely caused by their flawed design and inconsistent random sampling procedure. For example, a study on Chinese coal mining company employees showed hyperuricemia incidence of 6.87% in women vs. 8.57% in men [22]. Another Chinese study conducted in seven cities also found a higher prevalence of hyperuricemia in women compared with men (14.1% and 12.0%, respectively) [23]. However, the sample of that particular study included solely people over 60 YO, and therefore, its resulting patterns were indicative only for older people rather than total population.
Fairly large number of studies, investigating the causes of hyperuricemia prevalence levels, paid attention to gender differences in predictors related to lifestyle choices [10, 24, 25]. At the same time, depending on the set of predictors used in the study, its design and employed sampling procedure, such gender differences varied significantly.
Hyperuricemia versus BMI
In our study, BMI made the most significant impact on hyperuricemia levels in both men and women, which was consistent with results of numerous studies demonstrating the direct effect of BMI on serum uric acid concentration and hyperuricemia risks [12, 20, 22, 25]. In a comprehensive analysis of the lifestyle choices’ influence on hyperuricemia likelihood, obesity and (to a lesser extent) an increased BMI, as a rule, demonstrated the strongest effect. For example, in American study, the population attributive risk of hyperuricemia for overweight and obese people was 44%, while for alcohol consumption, diets, and diuretics, it was just 8-12% [26].
Hyperuricemia versus age
In our study, the association of age with hyperuricemia was detected solely in women, which was consistent with other studies [18, 20]. At the same time, women 35-44 yo were in the best position. The values of the odds ratios suggested a J-shaped hyperuricemia dependence on age in women, which matched the results of other studies [12, 22]. A likely cause of age associations with hyperuricemia in women was related to the changes in hormonal background during the menopause, approximately coinciding with increased hyperuricemia likelihood in women older than 45 yo in our study. In the meantime, the issue of what primarily affects the increase of hyperuricemia prevalence in women, menopause or age-related changes [27-29], has not been fully resolved and, undoubtedly, requires further investigation.
Several Chinese studies have shown a statistically significant decrease in the hyperuricemia likelihood of men, along with an age-related increase of it in women [10, 28]. In this regard, it should be noted that, in our study, the OR values in men, were also decreasing with age, but remained statistically insignificant, which may be indicative of an extremely weak trend. Besides, in our study, the association of hyperuricemia in the oldest age group, compared with the youngest group, approached statistical significance (OR=0.91; 95% CI: 0.82-1.01, p=0.066).
Along with studies, the results of which were consistent with our findings, some publications demonstrated the hyperuricemia likelihood increase with age in both gender groups, or solely in men [21, 25].
Hyperuricemia versus dietary patterns
Of the nutritional features in this study, the inverse associations of hyperuricemia with ‘smart’ DP were identified, which corresponded to the published data [30, 31]. ‘Smart’ DP in food products (vegetables, fruits, dairy products, cereals), as a rule, are inversely associated with hyperuricemia, which explains our finding.
At the same time, there were no statistically significant associations of adherence to ‘meat’ DP. The latter includes purine-rich meat products (including poultry), fish, and seafood, which, according to the literature, are associated with hyperuricemia [31, 32]. Besides, a number of studies with empirical approaches to assessment of diets indicated direct associations of ‘meat’ DP with hyperuricemia as well [17, 33]. The situation is similar for ‘mixed’ DP, including foods rich in purine (legumes, fish and seafood), which, hypothetically, tend to increase the likelihood of hyperuricemia. However, a number of studies demonstrated that vegetables rich in purine, particularly peas, beans, and lentils, included in the ‘mixed’ DP, did not increase the risk of gout and hyperuricemia [32, 34]. This finding is consistent with our results.
Despite the fact that a significant number of studies have been dedicated to investigating the dependences of hyperuricemia on nutritional characteristics, a number of researchers agreed that nutritional characteristics could only explain a small part of variability in hyperuricemia likelihood [31]. In the present study, this is evidenced by the relatively low importance of diets in predicting hyperuricemia, inferior to BMI, age and alcohol consumption in women, and BMI and smoking status in men.
Hyperuricemia versus alcohol consumption
Our results implied that excessive alcohol consumption was associated with increased hyperuricemia likelihood in both men and women. In addition, women exhibited a decrease in hyperuricemia likelihood with moderate alcohol consumption. Moreover, as the decision tree model predicted, this was only typical for older women. In some studies, alcohol use was associated with hyperuricemia solely in men, rather than in women [22, 25, 35, 36], whereas in other studies, on the contrary, solely in women, rather than in men [12, 24]; and in several publications, in both gender groups [19]. An increase in alcohol consumption is typically accompanied by an increase in the likelihood of hyperuricemia [26, 35, 37]. However, at light alcohol consumption, associations are often devoid of statistical significance.
Our study estimated total alcohol consumption, without differentiation into the types of alcoholic beverages. As a rule, researchers report associations of hyperuricemia with all types of alcohol, with the exception of wine [38, 39]. In addition, the strongest associations with hyperuricemia are often typical for beer consumption [35, 39]. We believe that, in the future, it is crucial to analyze the contribution of various types of alcoholic beverages to hyperuricemia likelihood in the RF population.
Hyperuricemia versus smoking
In our study, smoking had an effect on hyperuricemia likelihood only in men. In a number of studies, gender differences similar to ours were obtained: similar effect in men and the absence of the smoking status impact on hyperuricemia likelihood in women [10, 40]. In some publications, however, the likelihood of hyperuricemia was associated with smoking status in women rather than in men [11, 12, 25].
In our study, men who quit smoking exhibited an increase in the likelihood of hyperuricemia, while smokers had a decrease, as compared with those who never smoked, which is consistent with other studies [10, 40]. An increase in uric acid levels, among other effects of smoking cessation, was described in the 1980 article by G.D. Friedman and A.B. Siegelaub [41]. Such seemingly ‘protective’ effect of smoking and the ‘negative’ impact of its cessation were explained in a number of studies by the antioxidant role of uric acid. The latter is subjected to a decrease in its endogenous production, resulting in depletion of antioxidant protection as a result of chronic exposure to cigarette smoke, which, in turn, is a source of oxidative stress [11]. On the other hand, some studies (e.g. in Korea), on the contrary, indicated a direct effect of smoking or former smoking on the likelihood of developing hyperuricemia [11, 12]. In general, no consensus has yet been reached on the effect of smoking status on the likelihood of hyperuricemia. In 2018, in a systematic review, N. Fanning et al. examined the ‘health paradox’ as an inverse association of hyperuricemia with smoking and concluded that this phenomenon was not convincing, since a number of studies have indicated the opposite effect, or no effect, whatsoever [42].
The results of the decision tree in men were curious, showing that the combination of excessive alcohol consumption (regression-analysis-based direct associations) and smoking (regression-analysis-based inverse associations) led to a ‘protective’ reduction in the likelihood of hyperuricemia. The combined effect of alcohol and smoking, representing two types of addictive behavior, are synergistically related in the general population: smokers drink more often, and more alcohol at a time, than non-smokers; in turn, among people consuming alcohol, there are more smokers, and they are characterized by a higher smoking intensity [43]. More in-depth studies are needed on the combined effects of smoking and alcohol consumption on the likelihood of hyperuricemia.
Possible causes of result discordance
A partial inconsistency between our results and published data could be explained by insufficient subgroup sizes in other studies. For example, in a Chinese study, conducted solely on women, the likelihood of hyperuricemia was not associated with either moderate or excessive alcohol consumption [36]; however, the numbers of women with moderate and excessive alcohol consumption were just 74 and 121, which corresponded to only 1.2% and 2.0 % of all women, respectively. In the same study, sample sizes for analogous men subgroups were 751 (15.0%) and 1722 (34.5%). In this connection, a small number of observations in the subgroups of women could affect the power of statistical analysis, which was admitted by the authors of the study themselves.
In some studies, there was insufficient adjustment for potential lifestyle covariates, including the lack of physical activity parameters. Nevertheless, in our opinion, the main causes of discrepancies were ‘Russian features’, such as the consumption type of volumes and different kinds of alcoholic beverages, as well as possible genetic differences between populations.
It is believed that the proportion of variance of the hyperuricemia prevalence, explained by lifestyle factors, is negligible [26]. The level of uric acid and hyperuricemia incidence, despite their multifactorial nature, are rather difficult to predict. For example, the use of some predictive statistical methods allowed us obtaining the highest area under the curve (AUC) equal to 0.669, when using the naïve Bayes algorithm, and 0.775, when using the random forests algorithm [44]. In another study, the use of logistic regression analysis made it possible to obtain a model for predicting hyperuricemia with an AUC value of 0.746 [37].
Of the predictors that we have analyzed, only BMI, which showed the highest significance in predicting hyperuricemia, was unequivocally interpreted in other studies. The remaining parameters (age, nutrition, alcohol consumption, smoking status), and their gender-based specificities, were apparently less stable in associations with hyperuricemia and, depending on the combination with each other and the study population, could indicate different trends. The study showed just general patterns of the hyperuricemia likelihood development in the RF population, depending on gender and lifestyle choices. However, some associations require more in-depth analysis, or further research resulting in additional data.
Limitations and strengths
The strength of our results lies in the fact that they are based on a large sample of the Russian population of more than 20 thousand people, which includes 13 regions of all climatic and geographical zones of the country, with the exception of the Far North. In our study, for the first time, we analyzed the Russian characteristics of the formation of hyperuricemia levels depending on the characteristics of lifestyle in the sexual groups.
However, the results obtained have some limitations. The undoubted drawback of the study is the lack of physical activity parameters, which, according to published data, is one of the important lifestyle characteristics that affects uric acid levels and the likelihood of hyperuricemia. The lack of physical activity parameters is associated with technical difficulties during the survey, which ultimately led to an excessive loss of necessary data.
Another limitation is the use of a short version of the nutritional questionnaire without a serving size. However, although rare, such options for assessing diets, especially in mass studies, are being conducted.
The transverse nature of the study limits the results in terms of causal evidence of the conclusions.
Conclusion
Thus, in the RF population, we observed multiple associations of hyperuricemia with the characteristics of the lifestyle choices, which were partially gender-specific. In both gender groups, the most pronounced associations with hyperuricemia were established for BMI. However, associations with other characteristics and their severity differed among men and women. In women, the greatest impact on the likelihood of hyperuricemia, in decreasing order, was exerted by age, dietary patterns and alcohol consumption, while in men it was caused by their smoking status, dietary patterns and alcohol consumption. In many respects, our results are consistent with other studies, but due to the fact that the literature data are rather contradictory and often indicative of multidirectional trends, a more comprehensive analysis is required with the use of additional data.
Acknowledgments
The authors express their deep gratitude to the staff of the regional centers that took an active part in the data collection process: E.I. Baranova, A.O. Konradi (all from St. Petersburg); N.V. Kulakova, V.A. Nevzorova, N.V. Shestakova, M.V. Mokshina, L.V. Rodionova (all from Vladivostok); G.V. Tolparov (Vladikavkaz); V.A. Ilyin, A.A. Shabunova, K.N. Kalashnikov, O.N. Kalachikova, A.V. Popov (all from Vologda); S.V. Nedogoda, E.V. Chumachek, A.A. Ledyaeva (all from Volgograd); G.I. Furmenko, T.M. Chernykh, V.V. Ovsyannikova, L.V. Bondartsov (all from Voronezh); O.A. Belova, S.V. Romanchuk, O.A. Nazarova, O.A. Shutemova (all from Ivanovo); O.L. Barbarash, G.V. Artamonova, E.V. Indukayeva, T.A. Mulerova, A.E. Skripchenko, N.V. Cherkass, M.V. Tabakayev, Y.V. Danilchenko (all from Kemerovo); Yu.I. Grinshtein, M.M. Petrova, L.K. Danilova, A.A. Evsyukov, V.V. Shabalin, R.R. Ruf, A.A. Kosinova, I.V. Filonenko, O.A. Baykova (all from Krasnoyarsk); R.A. Libis, E.A. Lopina, I.R. Basyrova (all from Orenburg); D.V. Duplyakov, S.A. Gudkova, N.A. Cherepanova (all from Samara); I.A. Trubacheva, V.S. Kaveshnikov, R.S. Karpov, V.N. Serebryakova (all from Tomsk); A.Yu. Efanov, I.V. Medvedeva, M.A. Storozhok, S.V. Shalayev (all from Tyumen).
Conflict of interest
None declared.
- Li M, Hou W, Zhang X, Hu L, Tang Z. Hyperuricemia and risk of stroke: a systematic review and meta-analysis of prospective studies. Atherosclerosis 2014; 232(2): 265-270. http://doi.org/10.1016/j.atherosclerosis.2013.11.051.
- Cheserek MJ, Shi Y, Le G. Association of hyperuricemia with metabolic syndrome among university workers: sex and occupational differences. Afr Health Sci 2018; 18(4): 842-851. http://doi.org/10.4314/ahs.v18i4.2.
- Katsiki N, Papanas N, Fonseca VA, Maltezos E, Mikhailidis DP. Uric acid and diabetes: Is there a link? Curr Pharm Des 2013; 19(27): 4930-4937. http://doi.org/10.2174/1381612811319270016.
- Chen-Xu M, Yokose C, Rai SK, Pillinger MH, Choi HK. Contemporary prevalence of gout and hyperuricemia in the United States and decadal trends: the National Health and Nutrition Examination Survey, 2007-2016. Arthritis Rheumatol 2019; 71(6): 991-999. http://doi.org/10.1002/art.40807.
- Robinson PC, Taylor WJ, Merriman TR. Systematic review of the prevalence of gout and hyperuricaemia in Australia. Intern Med J 2012; 42(9): 997-1007. http://doi.org/10.1111/j.1445-5994.2012.02794.x.
- Liu R, Han C, Wu D, Xia X, Gu J, Guan H, et al. Prevalence of hyperuricemia and gout in Mainland China from 2000 to 2014: a systematic review and meta-analysis. Biomed Res Int 2015; 2015: 762820. http://doi.org/10.1155/2015/762820.
- Kumar AUA, Browne LD, Li X, Adeeb F, Perez-Ruiz F, Fraser AD, et al. Temporal trends in hyperuricaemia in the Irish health system from 2006-2014: a cohort study. PLoS One 2018; 13(5): e0198197. http://doi.org/10.1371/journal.pone.0198197.
- Rho YH, Zhu Y, Choi HK. The epidemiology of uric acid and fructose. Semin Nephrol 2011; 31(5): 410-419. http://doi.org/10.1016/j.semnephrol.2011.08.004.
- Dehghan A, Köttgen A, Yang Q, Hwang SJ, Kao WL, Rivadeneira F, et al. Association of three genetic loci with uric acid concentration and risk of gout: a genome-wide association study. Lancet 2008; 372(9654): 1953-1961. http://doi.org/10.1016/S0140-6736(08)61343-4.
- Yu S, Yang H, Guo X, Zhang X, Zhou Y, Ou Q, et al. Prevalence of hyperuricemia and its correlates in rural Northeast Chinese population: from lifestyle risk factors to metabolic comorbidities. Clin Rheumatol 2016; 35(5): 1207-1215. http://doi.org/10.1007/s10067-015-3051-6.
- Kim SK, Choe JY. Association between smoking and serum uric acid in Korean population: Data from the seventh Korea national health and nutrition examination survey 2016. Medicine (Baltimore) 2019; 98(7): e14507. http://doi.org/10.1097/MD.0000000000014507.
- Kim Y, Kang J, Kim GT. Prevalence of hyperuricemia and its associated factors in the general Korean population: an analysis of a population-based nationally representative sample. Clin Rheumatol 2018; 37(9): 2529-2538. http://doi.org/10.1007/s10067-018-4130-2.
- Shalnova SA, Deev AD, Artamonov GV, Duplyakov DV, Efanov AY, Zhernakova YV, et al. Hyperuricemia and its correlates in the Russian population (results of ESSE-RF epidemiological study). Rational Pharmacotherapy in Cardiology 2014; 10(2): 153-159. Russian. https://doi.org/10.20996/1819-6446-2014-10-2-153-159.
- Boitsov SA, Chazov EI, Shlyakhto EV, Shalnova SA, Konradi AO, Karpov YA, et al. Scientific Organizing Committee of the ESSE-RF. Epidemiology of cardiovascular diseases in different regions of Russia (ESSE-RF). The rationale for and design of the study. Prev Med 2013; 16(6): 25-34. Russian. https://elibrary.ru/item.asp?id=22291161.
- Roberts K, Cade J, Dawson J, Holdsworth M. Empirically derived dietary patterns in UK adults are associated with sociodemographic characteristics, lifestyle, and diet quality. Nutrients 2018; 10(2): 177. http://doi.org/10.3390/nu10020177.
- Maksimov SA, Ivanova OA, Zinchuk SF. The use of factor analysis in determining the dietary patterns in the population. Gig Sanit 2013; (2): 45-48. Russian. https://pubmed.ncbi.nlm.nih.gov/24003699.
- He F, Wang LL, Yu XL. Dietary patterns associated hyperuricemia among Chinese aged 45 to 59 years: An observational study. Medicine (Baltimore) 2017; 96(50): e9248. http://doi.org/10.1097/MD.0000000000009248.
- Lin X, Wang X, Li X, Song L, Meng Z, Yang Q, et al. Gender- and age-specific differences in the association of hyperuricemia and hypertension: a cross-sectional study. Int J Endocrinol 2019; 2019: 7545137. http://doi.org/10.1155/2019/7545137.
- Zhang X, Meng Q, Feng J, Liao H, Shi R, Shi D, et al. The prevalence of hyperuricemia and its correlates in Ganzi Tibetan Autonomous Prefecture, Sichuan Province, China. Lipids Health Dis 2018; 17(1): 235. http://doi.org/10.1186/s12944-018-0882-6.
- Nan H, Qiao Q, Dong Y, Gao W, Tang B, Qian R, et al. The prevalence of hyperuricemia in a population of the coastal city of Qingdao, China. J Rheumatol 2006; 33(7): 1346-1350. https://pubmed.ncbi.nlm.nih.gov/16821269.
- Liu B, Wang T, Zhao HN, Yue WW, Yu HP, Liu CX, et al. The prevalence of hyperuricemia in China: a meta-analysis. BMC Public Health 2011; 11: 832. http://doi.org/10.1186/1471-2458-11-832.
- Cui L, Meng L, Wang G, Yuan X, Li Z, Mu R, et al. Prevalence and risk factors of hyperuricemia: results of the Kailuan cohort study. Mod Rheumatol 2017; 27(6): 1066-1071. http://doi.org/10.1080/14397595.2017.1300117.
- Wang R, Tang Z, Sun F, Diao LJ. Prevalence of hyperuricemia in the elderly in 7 areas of China. Zhonghua Liu Xing Bing Xue Za Zhi 2018; 39(3): 286-288. Chinese. http://doi.org/10.3760/cma.j.issn.0254-6450.2018.03.007.
- Beydoun MA, Canas JA, Fanelli-Kuczmarski MT, Tajuddin SM, Evans MK, Zonderman AB. Genetic risk scores, sex and dietary factors interact to alter serum uric acid trajectory among African-American urban adults. Br J Nutr 2017; 117(5): 686-697. http://doi.org/10.1017/S0007114517000411.
- Song P, Wang H, Xia W, Chang X, Wang M, An L. Prevalence and correlates of hyperuricemia in the middle-aged and older adults in China. Sci Rep 2018; 8(1): 4314. http://doi.org/10.1038/s41598-018-22570-9.
- Choi HK, McCormick N, Lu N, Rai SK, Yokose C, Zhang Y. Population impact attributable to modifiable risk factors for hyperuricemia. Arthritis Rheumatol 2020; 72(1): 157-165. http://doi.org/10.1002/art.41067.
- Cho SK, Winkler CA, Lee SJ, Chang Y, Ryu S. The prevalence of hyperuricemia sharply increases from the late menopausal transition stage in middle-aged women. J Clin Med 2019; 8(3): 296. http://doi.org/10.3390/jcm8030296.
- Fang WG, Huang XM, Wang Y, Zhu WG, Bie ZX, Chen JL, et al. A cross-sectional study of hyperuricemia in state-employees in Beijing: prevalence and risk factors. Zhonghua Yi Xue Za Zhi 2006; 86(25): 1764-1768. Chinese. https://pubmed.ncbi.nlm.nih.gov/17054844.
- Hak AE, Choi HK. Menopause, postmenopausal hormone use and serum uric acid levels in US women – the Third National Health and Nutrition Examination Survey. Arthritis Res Ther 2008; 10(5): R116. http://doi.org/10.1186/ar2519.
- Esche J, Krupp D, Mensink GBM, Remer T. Dietary potential renal acid load is positively associated with serum uric acid and odds of hyperuricemia in the German adult population. J Nutr 2018; 148(1): 49-55. http://doi.org/10.1093/jn/nxx003.
- Major TJ, Topless RK, Dalbeth N, Merriman TR. Evaluation of the diet wide contribution to serum urate levels: meta-analysis of population based cohorts. BMJ 2018; 363: k3951. http://doi.org/10.1136/bmj.k3951.
- Villegas R, Xiang YB, Elasy T, Xu WH, Cai H, Cai Q, et al. Purine-rich foods, protein intake, and the prevalence of hyperuricemia: the Shanghai Men's Health Study. Nutr Metab Cardiovasc Dis 2012; 22(5): 409-416. http://doi.org/10.1016/j.numecd.2010.07.012.
- Liu X, Huang S, Xu W, Zhou A, Li H, Zhang R, et al. Association of dietary patterns and hyperuricemia: a cross-sectional study of the Yi ethnic group in China. Food Nutr Res 2018; 62. http://doi.org/10.29219/fnr.v62.1380.
- Jakše B, Jakše B, Pajek M, Pajek J. Uric acid and plant-based nutrition. Nutrients 2019; 11(8): 1736. http://doi.org/10.3390/nu11081736.
- Yu KH, See LC, Huang YC, Yang CH, Sun JH. Dietary factors associated with hyperuricemia in adults. Semin Arthritis Rheum 2008; 37(4): 243-250. http://doi.org/10.1016/j.semarthrit.2007.04.007.
- Li Z, Guo X, Liu Y, Chang Y, Sun Y, Zhu G, et al. The relation of moderate alcohol consumption to hyperuricemia in a rural general population. Int J Environ Res Public Health 2016; 13(7): 732. http://doi.org/10.3390/ijerph13070732.
- Liu H, Zhang XM, Wang YL, Liu BC. Prevalence of hyperuricemia among Chinese adults: a national cross-sectional survey using multistage, stratified sampling. J Nephrol 2014; 27(6): 653-658. http://doi.org/10.1007/s40620-014-0082-z.
- Stibůrková B, Pavlíková M, Sokolová J, Kožich V. Metabolic syndrome, alcohol consumption and genetic factors are associated with serum uric acid concentration. PLoS One 2014; 9(5): e97646. http://doi.org/10.1371/journal.pone.0097646.
- Choi HK, Curhan G. Beer, liquor, and wine consumption and serum uric acid level: the Third National Health and Nutrition Examination Survey. Arthritis Rheum 2004; 51(6): 1023-1029. http://doi.org/10.1002/art.20821.
- Yang T, Zhang Y, Wei J, Zeng C, Li LJ, Xie X, et al. Relationship between cigarette smoking and hyperuricemia in middle-aged and elderly population: a cross-sectional study. Rheumatol Int 2017; 37(1): 131-136. http://doi.org/10.1007/s00296-016-3574-4.
- Friedman GD, Siegelaub AB. Changes after quitting cigarette smoking. Circulation 1980; 61(4): 716-723. http://doi.org/10.1161/01.cir.61.4.716.
- Fanning N, Merriman TR, Dalbeth N, Stamp LK. An association of smoking with serum urate and gout: A health paradox. Semin Arthritis Rheum 2018; 47(6): 825-842. http://doi.org/10.1016/j.semarthrit.2017.11.004.
- Maksimov SA, Tsygankova DP, Artamonova GV. The relation of smoking and alcohol consumption with coronary heart disease and its risk factors (ESSE-RF in Kemerovskaya region). Cardiovascular Therapy and Prevention 2018; 17(3): 59-64. Russian. https://doi.org/10.15829/1728-8800-2018-3-59-64.
- Lee S, Choe EK, Park B. Exploration of machine learning for hyperuricemia prediction models based on basic health checkup tests. J Clin Med 2019; 8(2): 172. http://doi.org/10.3390/jcm8020172.
Received 15 November 2019, Accepted 28 February 2020
© 2019, Maksimov S.A., Shalnova S.A., Balanova Yu.A., Deyev A.D., Evstifeyeva S.E., Imayeva A.E., Kapustina A.V., Karamnova N.S., Muromtseva G.A., Rotar O.P., Shlyakhto E.V., Boytsov S.A., Drapkina O.M.
© 2019, Russian Open Medical Journal
Correspondence to Sergey A. Maksimov. Address: 10 Petroverigskiy Lane, Moscow, 101990, Russia. E-mail: m1979sa@yandex.ru.